Google Analytics 4 vs Mixpanel vs Amplitude: Product Analytics Pricing
The three vendors sell the same unit — the event — and price it three different ways. Google Analytics 4 charges nothing for the event and limits what you can do with it. Mixpanel publishes a per-volume ladder down to the dollar. Amplitude gives away the first two million events a month and asks you to open an estimator for the rest. A product doing one million events a month pays $0 on all three. A product doing ten million pays $0, $840, or about $576, depending on the vendor — and the cheapest of the three at that volume is the one whose free tier looks the least generous. This guide prices all three on the same event volumes, from the vendors' own pricing pages, and names the ceilings that actually force a switch: sampling thresholds, retention limits, and plan caps.
The unit: what an event costs to count
An event is one tracked action: a pageview, a button click, a purchase, a signup. Every plan in this guide is priced in events per month, except Google Analytics 360, which is priced in events per month inside an annual contract. The comparison only works if the event counts are the same, so fix the volumes first: 1 million events a month is a small product with a few thousand weekly actives; 10 million is a growing product with real funnels; 100 million is a mid-market product whose analytics bill is a budget line.
The three free tiers, from the vendors' own pages:
| Vendor | Free tier | What it includes | What it caps |
| :--- | :--- | :--- | :--- |
| Google Analytics 4 (standard) | $0, no event cap | Full reporting, 30 key events, BigQuery daily export of 1M events | 14-month data retention, sampling above 10M events per query |
| Mixpanel Free | $0, up to 1M events/month | Unlimited seats, 10K session replays/month, funnels and retention analysis | 1M events/month hard ceiling; 2-year default data retention |
| Amplitude Free | $0, up to 2M events/month | 10,000 MTUs, 10K session replays/month, 1 active experiment | 2M events/month hard ceiling; 2-year data retention |
Amplitude's free tier is the most generous number in the table — twice Mixpanel's. Google's free tier is the most generous in a different dimension: there is no monthly event cap at all, and the limits that bite are on reporting and export, not on collection.
> [!KEY TAKEAWAY]
> At one million events a month, all three vendors cost $0 — and that is the wrong conclusion. The decision is not the price at one million events. It is the price at ten million, the ceiling that forces an upgrade, and the limit that quietly degrades the data before the bill ever arrives.
The priced ladder: Mixpanel, published to the dollar
Mixpanel is the only vendor of the three that publishes a complete price ladder. The Growth plan includes 1 million events a month in the base price and bills additional volume in bands, on annual billing:
| Events/month | Mixpanel Growth (annual billing) | Cost per event |
| :--- | :--- | :--- |
| 1M | $0 | $0 |
| 1.5M | $100/month | $0.000067 |
| 2M | $185/month | $0.000093 |
| 3M | $270/month | $0.000090 |
| 5M | $438/month | $0.000088 |
| 10M | $840/month | $0.000084 |
| 20M | $1,635/month | $0.000082 |
$
\text{Mixpanel at 10M events} = \$840/\text{month} = \$10{,}080/\text{year}
$
$
\text{Mixpanel cost per event at 10M} = \frac{\$840}{10{,}000{,}000} = \$0.000084
$
Two facts about this ladder matter more than the prices. First, the per-event cost falls as volume rises — $0.000093 at 2 million, $0.000082 at 20 million — so the marginal event gets cheaper and the total still roughly doubles every time the volume doubles. Second, Growth caps at 20 million events a month. Past that, the price is an Enterprise conversation, not a number on the page. A product growing from 10 million to 25 million events does not slide up the ladder; it jumps off it.
Monthly billing costs more: at 1.5 million events, the page shows $100 a month on annual billing against $480 a year saved versus monthly — which prices monthly billing at $140 a month for the same volume.
Amplitude: the free tier is generous, the price is an estimator
Amplitude's pricing page states the structure plainly: the Free plan covers 2 million events a month with no time limit, the Plus plan starts at $0 and scales with event volume up to 70 million events a month — roughly 700,000 monthly tracked users at about 100 events per user — and the Growth plan is custom event-based pricing on a sales conversation. The page publishes no per-event rate for Plus. It points to an estimator.
An independent re-read of Amplitude's own Plus calculator, checked in October 2026, prices the curve at $75 a month at 3 million events, $576 a month at 10 million, $1,260 a month at 20 million, and $4,692 a month at the 70 million ceiling, on annual billing. Those are calculator figures corroborated by an independent read, not figures printed on the vendor's pricing page — and they are the only dollar figures available for Plus at volume. Treat them as the best available read, and run the vendor's own estimator before signing anything.
$
\text{Amplitude Plus at 10M events (calculator read)} = \$576/\text{month} = \$6{,}912/\text{year}
$
$
\text{Amplitude cost per event at 10M} = \frac{\$576}{10{,}000{,}000} = \$0.000058
$
At 10 million events, Amplitude's calculator read is $264 a month cheaper than Mixpanel's published ladder — $3,168 a year. At 20 million, the gap is $375 a month, $4,500 a year. But the comparison is asymmetric: Mixpanel's figure is a price you can buy from the page, and Amplitude's is a figure from an estimator you must open. The vendor that publishes its price can be held to it. The vendor that hides its price behind a calculator can change the calculator.
Google Analytics 4: free, until the limits matter
Standard GA4 costs $0 at every volume in this guide. There is no subscription, no traffic-based fee, and no paid upgrade inside the product. The paid version is Google Analytics 360, a separate enterprise contract sold through Google sales or a certified partner. Google does not publish a price list for 360. A reseller reported a suggested retail price starting at $50,000 a year, which includes 25 million events a month, with a base fee plus per-event charges above that. That $50,000 figure is reseller-reported, not Google-published — and it is the only number anyone can quote, because Google publishes none.
The free tier's limits, from Google's own support pages, are where the decision actually lives:
| Limit | GA4 standard (free) | Google Analytics 360 |
| :--- | :--- | :--- |
| Price | $0 | Contract, reported from ~$50,000/year for 25M events/month |
| Data retention (explorations) | 2 or 14 months | Up to 50 months |
| Sampling threshold per query | 10M events | 100M by default, up to 1B |
| BigQuery daily export | 1M events/day | Billions of events/day |
| Key events | 30 | 50 |
| Data API quota | 200,000 tokens/day | 2,000,000 tokens/day |
Sampling is the limit that bites first. On a standard property, an exploration query that touches more than 10 million events is sampled — Google estimates from a subset, and the numbers stop being exact. A product doing 10 million events a month crosses that threshold in a single month of analysis. BigQuery export is the second bite: 1 million events a day in the daily export means a product doing 10 million events a month can export roughly three days of data per day of export — workable, but the export is a bottleneck, not a pipeline. Streaming export has no limit, which is the escape hatch Google leaves open.
!Mixpanel Growth pricing estimator
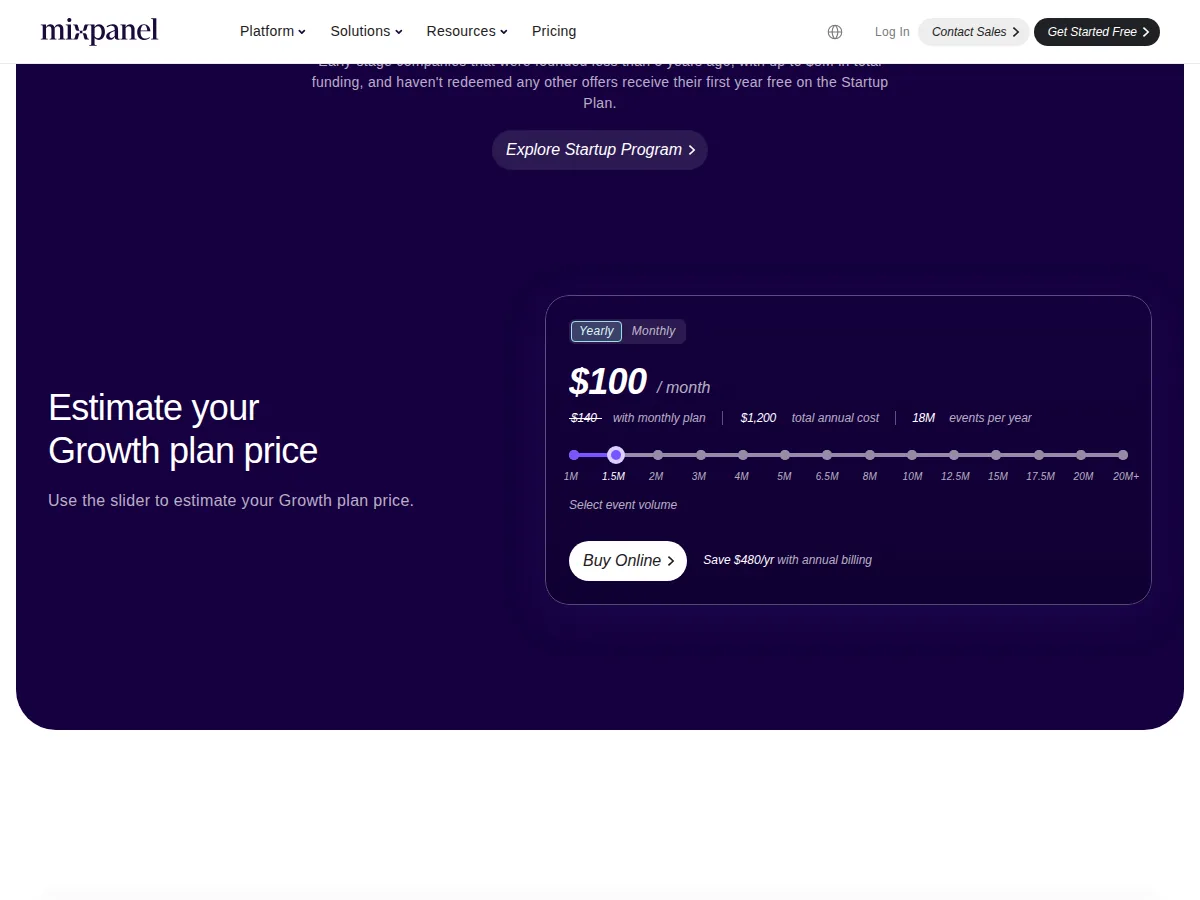
Mixpanel's Growth estimator at 1.5 million events a month: $100 a month on annual billing against $140 monthly, $1,200 total annual cost for 18 million events a year — and $480 a year saved by billing annually.
The cost table: same volumes, all three vendors
| Events/month | GA4 standard | Mixpanel Growth (annual) | Amplitude Plus |
| :--- | :--- | :--- | :--- |
| 1M | $0 | $0 | $0 |
| 10M | $0 | $840/month ($10,080/year) | ~$576/month ($6,912/year, calculator read) |
| 20M | $0 | $1,635/month ($19,620/year) | ~$1,260/month ($15,120/year, calculator read) |
| 70M | $0 | Enterprise quote (Growth caps at 20M) | ~$4,692/month ($56,304/year, calculator read, Plus ceiling) |
| 100M | $0 | Enterprise quote | Growth quote (Plus caps at 70M) |
$
\text{Annual gap at 10M, Mixpanel vs Amplitude} = (\$840 - \$576) \times 12 = \$3{,}168
$
$
\text{Annual gap at 20M, Mixpanel vs Amplitude} = (\$1{,}635 - \$1{,}260) \times 12 = \$4{,}500
$
The table hides the real trade. GA4 is $0 at every volume, but the product doing 100 million events a month on standard GA4 is analyzing sampled data with 14-month retention and a 1-million-event daily BigQuery export. The $0 price is real; the data degradation is also real. Mixpanel and Amplitude charge for exactness: unsampled funnels, cohort retention, session replay, and per-user paths and LTV cohorts that GA4's aggregated reports do not offer. The question is never which SaaS vendor is cheapest. It is whether the analysis the business runs needs per-user exactness or aggregated trends — answered by the reports the team actually opens, not by the pricing page.
!Google Analytics 360 feature limits table
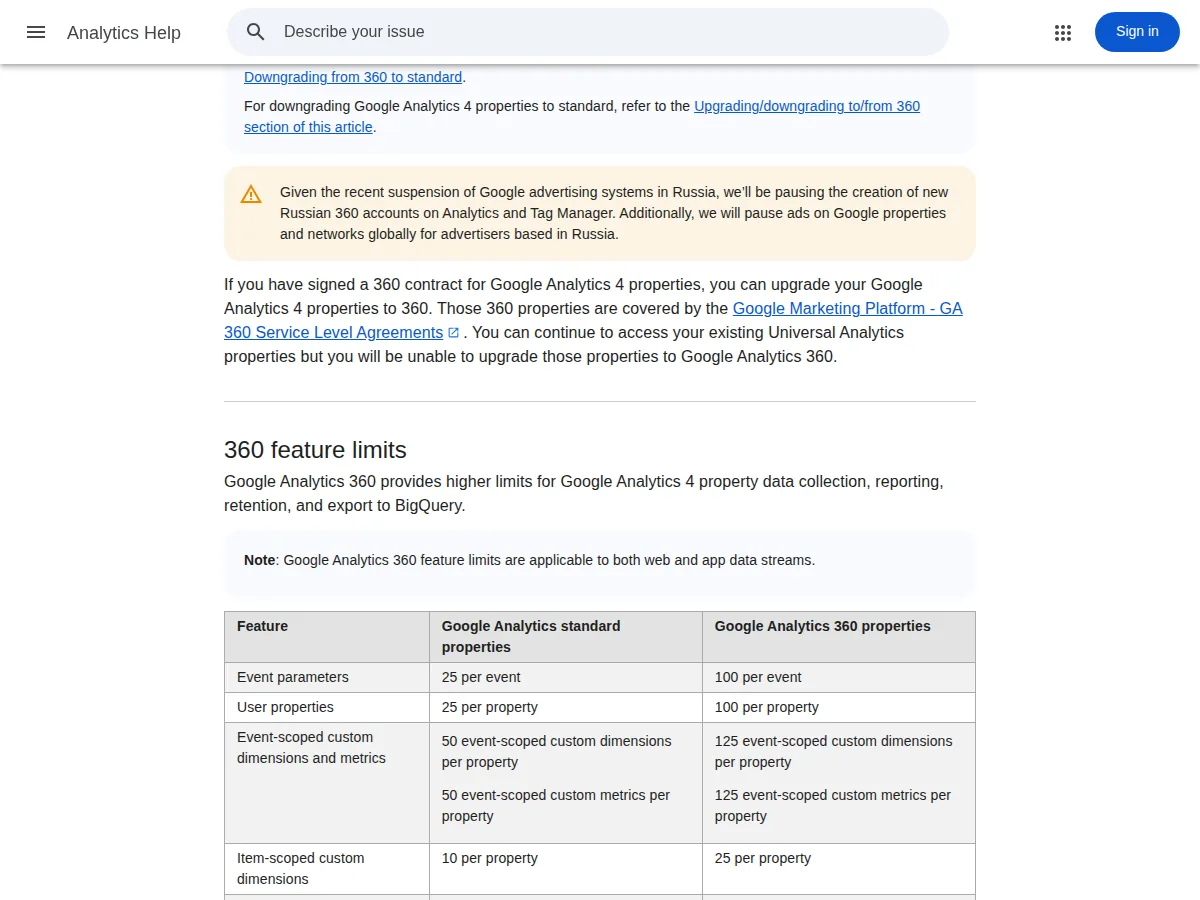
Google's own Analytics 360 help page: standard properties get 25 event parameters, 25 user properties, and 50 event-scoped custom dimensions per property; 360 raises each to 100, 100, and 125.
Decision table: which vendor, for which product
| Product shape | Pick | Authority |
| :--- | :--- | :--- |
| Pre-revenue, under 1M events/month | Any — all three are $0 | Mixpanel Free 1M, Amplitude Free 2M, GA4 $0 no cap |
| Early traction, 1–10M events, needs funnels | Amplitude Plus or Mixpanel Growth | Amplitude calculator read $576/month at 10M; Mixpanel published $840/month at 10M |
| Marketing-led, needs channel attribution | GA4 standard | $0, 30 key events, native Google Ads integration for CAC reporting |
| 10–20M events, per-user retention analysis | Amplitude Plus (cheaper) or Mixpanel Growth (published price) | Calculator read vs published ladder; $3,168/year gap at 10M |
| Over 20M events | GA4 360, Amplitude Growth, or Mixpanel Enterprise — all quotes | Mixpanel Growth caps at 20M; Amplitude Plus caps at 70M |
| Regulated data, 50-month retention need | GA4 360 or a paid plan with custom retention | GA4 standard caps at 14 months; Mixpanel default 2 years |
Operator boundaries: who should not buy each vendor
Do not buy Mixpanel Growth on monthly billing without pricing the annual discount — at 1.5 million events, monthly billing is $140 a month against $100 annual, a 40% premium for the same volume. Do not choose Amplitude Plus on the free tier alone: the first 2 million events are free, but the price past that point lives in an estimator, and a product growing from 2 million to 10 million events goes from $0 to roughly $576 a month with no published rate to hold the vendor to. Do not run a 100-million-event product on standard GA4 and expect exact funnels — sampling above 10 million events per query means the numbers are estimates, and the BigQuery daily export cap means the raw data arrives three days late. And do not pick any of the three on price alone: the Google Ads versus Meta Ads ROAS guide prices the traffic that generates the events, the email marketing pricing guide prices the retention channel the events feed, and the LinkedIn versus Google Ads B2B lead-cost guide prices the leads the funnels must convert.
> [!FOUNDER]
> "Analytics vendors price the event, but the business pays for the decision. A funnel that samples at 10 million events tells you the direction and lies about the magnitude — and the magnitude is the budget. Buy the vendor whose limit you will hit last, not the vendor whose free tier is biggest, because the free tier is a runway and the ceiling is the wall at the end of it."
> — Enow A. Jovial, Founder & Chief Executive Officer
Execution checklist
Run the analytics cost for your own event volume through the ROI calculator before you commit: the monthly bill here gives you the cost, and the calculator turns it into the payback period on the decisions the data drives.
> [!WARNING]
> Mixpanel Growth caps at 20 million events a month and Amplitude Plus caps at 70 million. Past those ceilings there is no published price — only an Enterprise or Growth sales conversation. A product growing through a ceiling without a quote in hand has no analytics budget, only a surprise.
> [!TIP]
> Before you migrate, send one real week of events to the cheapest vendor's free tier and build the three reports your team opens every Monday. The build takes an afternoon and answers the only question the pricing page cannot: whether the free tier's limits degrade the numbers you actually decide on.