Financial Statement Analysis Ratios: The Operator's Playbook
Revenue of $331,839 million and net income of $133,749 million tell you Microsoft had a large, profitable year. They say nothing about whether the company could pay next month's bills, how much of that profit arrived as cash, or what drives a 34.0% return on equity. Ratio analysis turns statement totals into those answers: divide one audited line by another, and the quotient carries information neither line carries alone.
This playbook runs the full operation on one real set of statements — Microsoft's fiscal 2026 Form 10-K, filed July 29, 2026 — so every number below traces to a line you can open. Liquidity first, then solvency, profitability, the DuPont decomposition tying profitability to leverage, and the cash-conversion linkage testing whether the profit is real. No ratio is asserted without its inputs.
The authority frame: why these lines divide cleanly
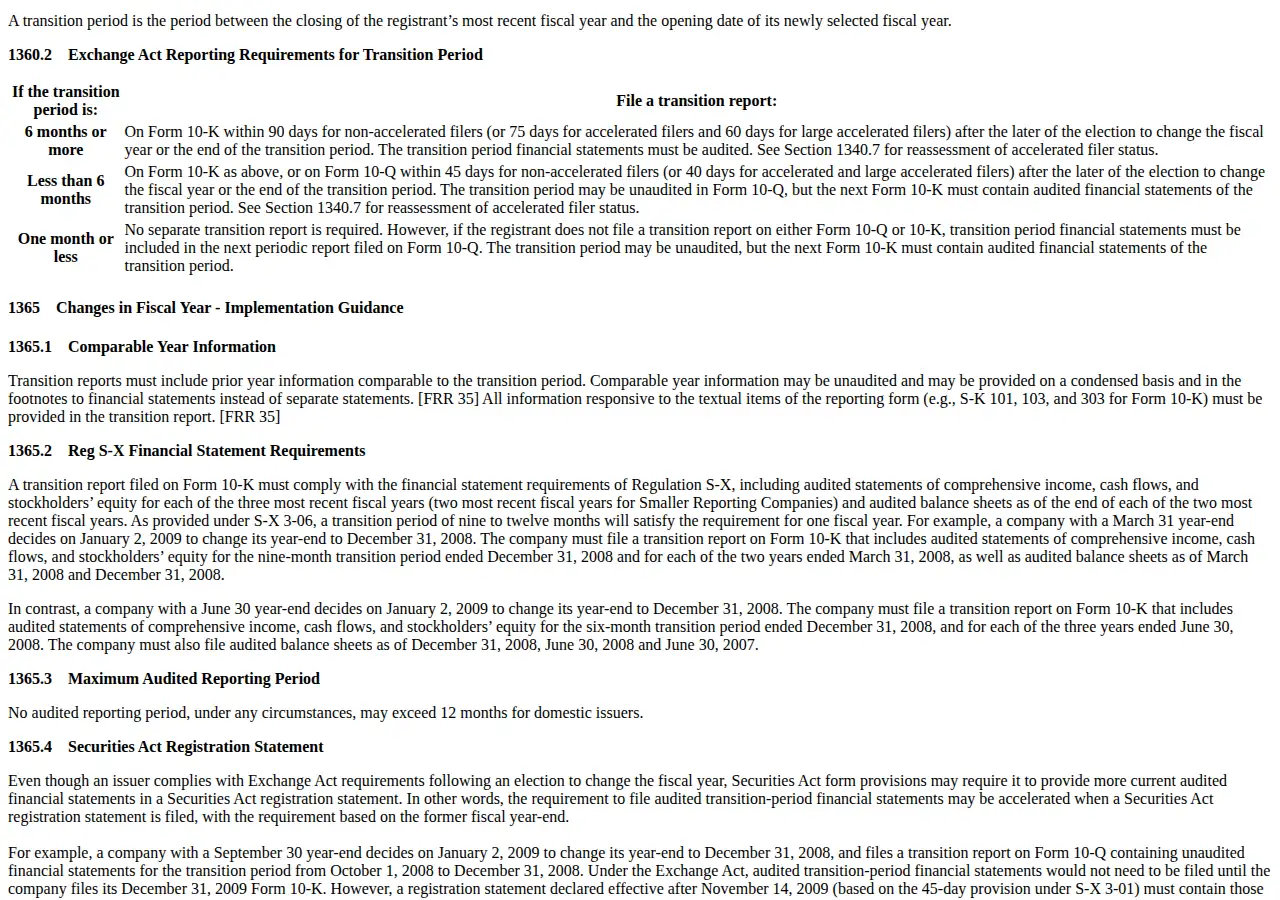
The statements themselves are not optional paperwork. Section 13(a) of the Securities Exchange Act of 1934, 15 U.S.C. § 78m, imposes the periodic-report duty that produces the Form 10-K. Inside the filing, presentation rules come from two directions: the SEC's Regulation S-X — Rule 5-02 for balance sheets and Rule 5-03 for statements of comprehensive income — and U.S. GAAP, whose presentation framework lives in FASB ASC Topics 205 (presentation), 210 (balance sheet), and 230 (statement of cash flows). The SEC's Financial Reporting Manual, Topic 1, states the combined position: Regulation S-X and U.S. GAAP must be followed by domestic issuers. That shared rulebook is why these inputs are comparable across issuers.
!SEC Financial Reporting Manual Topic 1 page
ASC 210 is the classification rule that makes liquidity ratios possible. It requires assets and liabilities to be split into current and non-current, with "current" meaning expected to convert to cash, or to settle, within one year or the normal operating cycle, whichever is longer. Without that split there is no current ratio — only assets and liabilities with no time dimension. ASC 230 does the same work for cash: it requires the statement of cash flows split into operating, investing, and financing, which lets the solvency section use operating cash flow instead of a single cash balance.
The worked set: one issuer, one year, every input named
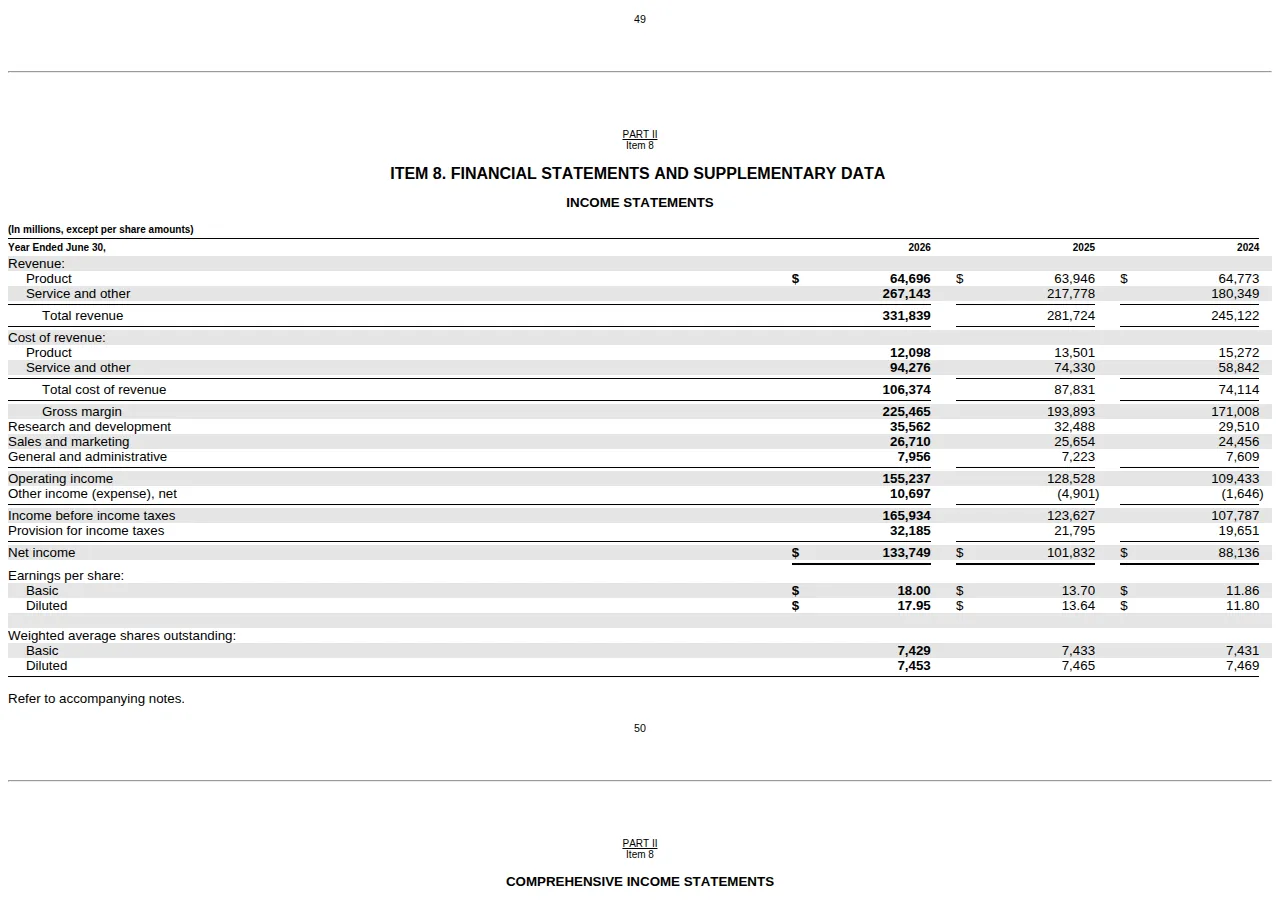
All figures are in $ millions, for the year ended June 30, 2026, with the prior year alongside where a ratio needs it. Before any division, check the statements foot: liabilities of $315,989 million plus equity of $442,387 million equals assets of $758,376 million, and operating income of $155,237 million plus other income of $10,697 million less tax of $32,185 million equals net income of $133,749 million. A ratio built on statements that do not foot is built on sand.
| Statement line | FY2026 | FY2025 |
|---|---|---|
| Total current assets | 207,710 | 191,131 |
| Total current liabilities | 168,825 | 141,218 |
| Total assets | 758,376 | 619,003 |
| Total equity | 442,387 | 343,479 |
| Revenue | 331,839 | 281,724 |
| Operating income | 155,237 | 128,528 |
| Net income | 133,749 | 101,832 |
| Interest expense | 3,051 | 2,385 |
| Operating cash flow | 182,935 | 136,162 |
Liquidity: can the next twelve months be paid?
Working capital is the cushion: $207,710 million minus $168,825 million equals $38,885 million. The current ratio turns that cushion into a multiple:
$
\text{Current ratio} = \frac{\text{Current assets}}{\text{Current liabilities}} = \frac{207{,}710}{168{,}825} = 1.23
$
Current assets cover current liabilities 1.23 times. A year earlier the ratio was $191,131 / $141,218 = 1.35, so cover thinned even as the cushion grew: current liabilities rose 19.5% while current assets rose 8.7%. The direction matters more than the level, and the driver is visible: short-term unearned revenue jumped to $72,965 million, and accounts payable rose 53% to $42,416 million as the datacenter build-out ran through suppliers.
The quick ratio strips out lines that cannot turn into cash on demand. Quick assets are cash of $20,935 million plus short-term investments of $55,908 million plus receivables of $80,876 million, totalling $157,719 million, and $157,719 / $168,825 = 0.93. Below 1.0: liquid assets alone do not fully cover current liabilities. The 0.30 gap to the current ratio is almost entirely "other current assets" of $48,594 million — open the notes and learn what sits in that line before concluding anything about near-term cover. The cash ratio sharpens the point: cash plus short-term investments of $76,843 million divided by $168,825 million is 0.46, and cash alone is 0.12. Microsoft holds plenty of liquidity, mostly one step removed from cash in securities and receivables.
> [!KEY TAKEAWAY]
> Read the current and quick ratios as a pair. The 0.30 gap between 1.23 and 0.93 is a question, not an answer: it points at the $48,594 million of other current assets, and the notes are where that question gets answered.
One caution belongs in liquidity. Short-term unearned revenue of $72,965 million is 43% of current liabilities, and it will not be settled in cash — it will be settled by delivering software and cloud services already paid for. A current ratio treats it as a claim like any other, which overstates the cash pressure, and an operator who ignores that composition will demand a buffer the business does not need.
Solvency: how much of the building is borrowed?
Total debt is the current portion of long-term debt, $9,227 million, plus long-term debt of $31,067 million: $40,294 million. Against equity of $442,387 million, debt-to-equity is $40,294 / $442,387 = 0.09; against total assets of $758,376 million, debt-to-assets is 0.05. Using all liabilities: $315,989 / $442,387 = 0.71 total-liabilities-to-equity, and the equity ratio is $442,387 / $758,376 = 0.58 — fifty-eight cents of every asset dollar is funded by shareholders, not creditors.
Interest coverage asks whether earnings can carry the debt. Earnings before interest and tax equal income before income taxes of $165,934 million plus interest expense of $3,051 million, or $168,985 million:
$
\text{Interest coverage} = \frac{\text{EBIT}}{\text{Interest expense}} = \frac{168{,}985}{3{,}051} = 55.4\times
$
The cross-check uses operating income alone as the EBIT proxy: $155,237 / $3,051 = 50.9 times. Earnings cover interest more than fifty times over; the constraint on borrowing is willingness, not ability to pay. The debt-service coverage ratio brings principal into the frame: operating cash flow of $182,935 million against debt service of interest of $3,051 million plus debt repayments of $3,000 million, or $6,051 million, gives $182,935 / $6,051 = 30.2 times. Those multiples show a borrower whose cash flow could service its debt load thirty times in a year.
> [!WARNING]
> Solvency ratios flatter a company that has simply chosen not to borrow. Microsoft's 0.09 debt-to-equity ratio describes a capital structure, not a law of nature: the same earnings would support far more debt, and a board that decided to lever up could move every ratio in this section within a year. Judge solvency against the strategy, not the snapshot.
Profitability: where the margin is made
Gross margin is $225,465 / $331,839 = 67.9%. Operating margin is $155,237 / $331,839 = 46.8%. Net margin is $133,749 / $331,839 = 40.3%, up from 36.1% the prior year ($101,832 / $281,724). Margin expanded: revenue grew 17.8% and operating income 20.8%, as research, sales, and administrative spending grew more slowly than the top line. To model how a margin change lands on your own numbers before committing to a price or a hire, run the figures through the profit calculator.
Return on assets and return on equity need average balances, not year-end ones. Total assets grew 22.5% during the year and equity grew 28.8%, so a year-end denominator would understate the capital actually at work. Average assets are ($758,376 + $619,003) / 2 = $688,690 million (rounded), and average equity is ($442,387 + $343,479) / 2 = $392,933 million. Return on assets is $133,749 / $688,690 = 19.4%; return on equity is $133,749 / $392,933 = 34.0%. On year-end balances alone the same returns read 17.6% and 30.2% — the same profit, a different denominator, so state the averaging choice every time the ratio is quoted.
!Microsoft 10-K income statement
| Ratio | FY2026 | Question it answers | Authority |
|---|---|---|---|
| Current ratio | 1.23 | Can current assets cover current liabilities? | ASC 210-10-45; Reg S-X Rule 5-02 |
| Quick ratio | 0.93 | Can liquid assets cover them without selling inventory? | ASC 210-10-45 |
| Interest coverage | 55.4x | Can earnings carry the interest bill? | ASC 230-10; Reg S-X Rule 5-03 |
| Return on equity | 34.0% | What did shareholders earn on average capital? | ASC 205-10; ASC 210-10 |
| Cash conversion cycle | -52 days | Does the business collect before it pays? | ASC 210-10-45; ASC 230-10 |
DuPont: what is actually driving the 34.0%?
Return on equity of 34.0% is a headline, not an explanation. The three-factor DuPont decomposition splits it into margin, turnover, and leverage, and shows which lever is doing the work:
$
\text{ROE} = \frac{\text{Net income}}{\text{Revenue}} \times \frac{\text{Revenue}}{\text{Average assets}} \times \frac{\text{Average assets}}{\text{Average equity}} = 0.4031 \times 0.4818 \times 1.7527 = 0.3404
$
Net margin is 0.4031. Asset turnover is $331,839 / $688,690 = 0.4818: each asset dollar produces forty-eight cents of revenue, a low turn reflecting property and equipment of $313,076 million — the datacenter and AI build-out. The equity multiplier is $688,690 / $392,933 = 1.7527: modest leverage, consistent with the 0.09 debt-to-equity ratio. Multiply the three factors and the product is 0.3404, the 34.0% return on equity — the decomposition reconciles exactly, and any version that does not has an arithmetic error in its inputs.
The story is margin-led, not leverage-led: Microsoft earns its return by keeping forty cents of every revenue dollar, not by turning assets quickly or borrowing heavily. That is durable and demanding: if the margin compresses — cloud pricing pressure, AI infrastructure costs, a mix shift toward lower-margin services — no turnover or leverage lever is large enough to replace it. To see the leverage leg in isolation, model a capital change through the ROI calculator before assuming more debt lifts the return.
> [!TIP]
> Always run DuPont on average balances and reconcile the product to ROE. If the three factors do not multiply back to the return you started with, stop and find the wrong input — usually a year-end balance used where an average belongs, or revenue taken from the wrong year.
The cash-conversion linkage: is the profit real?
Profit is recognised when earned; cash arrives when collected. The linkage ratios test the gap. Days sales outstanding is $80,876 / $331,839 × 365 = 89.0 days. Days inventory outstanding is $1,397 / $106,374 × 365 = 4.8 days — a software business carries almost no stock. Days payable outstanding is $42,416 / $106,374 × 365 = 145.5 days. The cash conversion cycle is 89.0 + 4.8 − 145.5 = −51.7 days, about −52 days: Microsoft collects from customers roughly fifty-two days before paying suppliers. The mechanism is visible on the balance sheet: customers pay in advance — short-term unearned revenue stands at $72,965 million — while suppliers are paid on long terms, so the operating cycle funds itself. The cash conversion cycle and DSO reduction playbook runs the full cycle math and the levers that move each leg.
The second linkage test is operating cash flow against net income: $182,935 / $133,749 = 1.37. Cash flow exceeds profit by more than a third, which is what a healthy accrual business shows: non-cash charges such as depreciation, amortisation, and other charges of $38,534 million are added back, and working capital movements are modest against earnings. Free cash flow completes the picture: operating cash flow of $182,935 million less additions to property and equipment of $115,948 million equals $66,987 million, a 20.2% margin on revenue. The cash flow statement indirect-method playbook reconciles net income to operating cash flow line by line, and the deferred revenue SaaS balance-sheet recognition playbook runs the waterfall behind the unearned revenue balance that makes the negative cycle possible.
> [!FOUNDER]
> "A ratio is a question you ask the statements, not an answer they give you. The current ratio asks whether next year is funded. DuPont asks what earns the return. The cash conversion cycle asks whether the profit is cash. Ask all three, in that order, and the statements start talking."
> — Enow A. Jovial, Founder & Chief Executive Officer
The execution checklist: run the operation yourself
1. Pull the 10-K from EDGAR; confirm the filing date, fiscal year-end, and that the statements are audited.
2. Copy the balance-sheet and income-statement lines into one table; check that the balance sheet balances and the income statement foots.
3. Split current from non-current exactly as ASC 210 requires; flag any line whose classification you cannot defend.
4. Compute working capital, current ratio, quick ratio, and cash ratio — then read the current and quick ratios as a pair.
5. Build total debt from the current portion plus long-term debt, then compute debt-to-equity, interest coverage with EBIT equal to income before tax plus interest, and DSCR on operating cash flow.
6. Compute gross, operating, and net margins on revenue, and ROA and ROE on average balances — never year-end balances alone.
7. Run the three-factor DuPont decomposition and confirm the product reconciles to ROE.
8. Compute DSO, DIO, and DPO, derive the cash conversion cycle, and divide operating cash flow by net income.
9. Compare every ratio with the prior year and one genuine peer; never judge a ratio without a comparison.
10. Write down the three judgments the ratios force — liquidity, solvency, profitability — and file the source lines beside the memo so the next reader can re-perform the work.
What ratios cannot do
Ratios inherit every limitation of the statements they divide. They are a one-year photograph: Microsoft's ratios describe fiscal 2026, and a single year cannot show whether the margin expansion from 36.1% to 40.3% is a trend or a one-off gain year — other income of $10,697 million includes $6.5 billion of net OpenAI investment gains, which is not operating performance. Ratios also assume the statements are fairly presented; they cannot detect misstatement, only make its consequences visible. And they do not travel across industries: a 1.23 current ratio and a −52-day cycle describe a prepaid-subscription software business, and the same thresholds would misread a manufacturer or a retailer. Run the same operation on your own books: your LLC, S-Corp, or C-Corp files under its EIN, your CPA signs the GAAP presentation, and the payroll lines carry FICA and SECA taxes. Export the trial balance as a CSV and the same formulas run.
Use the ratios to ask better questions of the statements and the notes — never as a substitute for reading them.