Value-Based Pricing Playbook: Set the Price on Value, Not Cost
Value-Based Pricing Playbook: Set the Price on Value, Not Cost
Most founders set price by looking down at their costs or sideways at their competitors. Both miss the number that decides whether the business makes money: what the buyer will pay. A McKinsey study of the Global 1200 found that if companies raised prices by just 1 percent, and demand stayed constant, average operating profits would rise by 11 percent — and the effect is larger where margins are thin: Sears 155 percent, McKesson 100 percent.
This playbook covers the pricing decision itself: the three ways to set a price, willingness to pay, the elasticity math behind a rise, the margin-volume trade-off, tiering and anchoring, and the price-change sequence. Every worked number comes from a stated model — Northwind Analytics, a B2B software company — so you can rerun the arithmetic on your own numbers.
The three ways to set a price
Every price is set by one of three methods, and each one fails in a different way.
Cost-plus. Add a markup to unit cost. It guarantees a margin on paper and ignores the buyer.
Competitor-based. Price at or near the rival's number. It is fast, but it hands your pricing to a competitor with different costs. If the rival is pricing to buy share, you copy a loss.
Value-based. Price from the buyer's willingness to pay, measured before the launch. It is the only method that prices the outcome instead of the input — but it needs real research: interviews, a Van Westendorp survey, and an elasticity estimate.
| Method | Price anchor | What it ignores | When it is the right choice | Authority |
|---|---|---|---|---|
| Cost-plus | Unit cost plus markup | Buyer value and demand | Floor check only | OpenStax, Principles of Economics 3e, section 5.1 |
| Competitor-based | Rival's published price | Your own costs and value gap | Commodity markets only | Stripe pricing page, 2026-11-11 |
| Value-based | Measured willingness to pay | Nothing — it prices the outcome | Differentiated products | Van Westendorp Price Sensitivity Meter |
Cost-plus still earns a place as the floor: below full unit cost, the product loses money on every sale. Competitor pricing earns a place as a sanity check: a price far above every rival needs a value story the buyer can repeat in one sentence. Neither one sets the price.
Cost-plus, worked: the floor, not the price
Northwind Analytics sells a B2B planning tool. The stated model: variable cost 40 dollars per user per month, fixed costs 30,000 dollars a month, 1,000 paying users at 99 dollars a month. Full unit cost is variable cost plus fixed cost per user:
A 25 percent markup on full cost gives a cost-plus price of 87.50 dollars:
At 87.50 dollars the contribution per user is 47.50 dollars, and under the demand model below the lower price draws 1,204 users, for a monthly profit of 27,166 dollars. The floor works. The problem is what it leaves behind: the value-based price found later in this guide is 120 dollars, and at that price the same business earns 29,947 dollars a month — 2,781 dollars more every month, 33,372 dollars more a year. Cost-plus did not lose money. It quietly gave away 33,372 dollars a year.
Price elasticity: the number that decides whether a rise helps
Elasticity measures how much volume moves when price moves. Price elasticity of demand is the percentage change in quantity demanded divided by the percentage change in price, and the midpoint method divides each change by the average of the two points:
As price falls from 70 to 60 dollars, quantity rises from 2,800 to 3,000: quantity changes 200/2,900, or 6.9 percent, and price changes minus 10/65, or minus 15.4 percent, so elasticity is 6.9 divided by minus 15.4, or 0.45 in absolute value — inelastic, because quantity moves less, in percentage terms, than price. On the supply side, a rent rising from 650 to 700 dollars a month lifts units supplied from 10,000 to 13,000: quantity changes 26.1 percent, price changes 7.4 percent, and supply elasticity is 3.53 — elastic.
Two facts matter. First, slope is not elasticity: on the textbook demand curve the price drops by 10 dollars and quantity rises by 200 units at every step, so the slope stays minus 10 over 200, while elasticity rises from 0.45 to 1.47 along the curve. Second, elasticity is a ratio of two percentages, so it carries no units. The operating rule: below 1 in absolute value, demand is inelastic and a price rise adds more revenue than the lost volume takes away; above 1, the volume loss outweighs the higher price. Estimate your own number from two real price points in your history.
Willingness to pay: the Van Westendorp meter
The Van Westendorp Price Sensitivity Meter tells you where the acceptable price range sits before you choose. It asks each respondent four questions: at what price so expensive you would not buy it; at what price so cheap you would doubt the quality; at what price starting to get expensive, so you would have to think about it; and at what price a bargain, a great buy for the money.
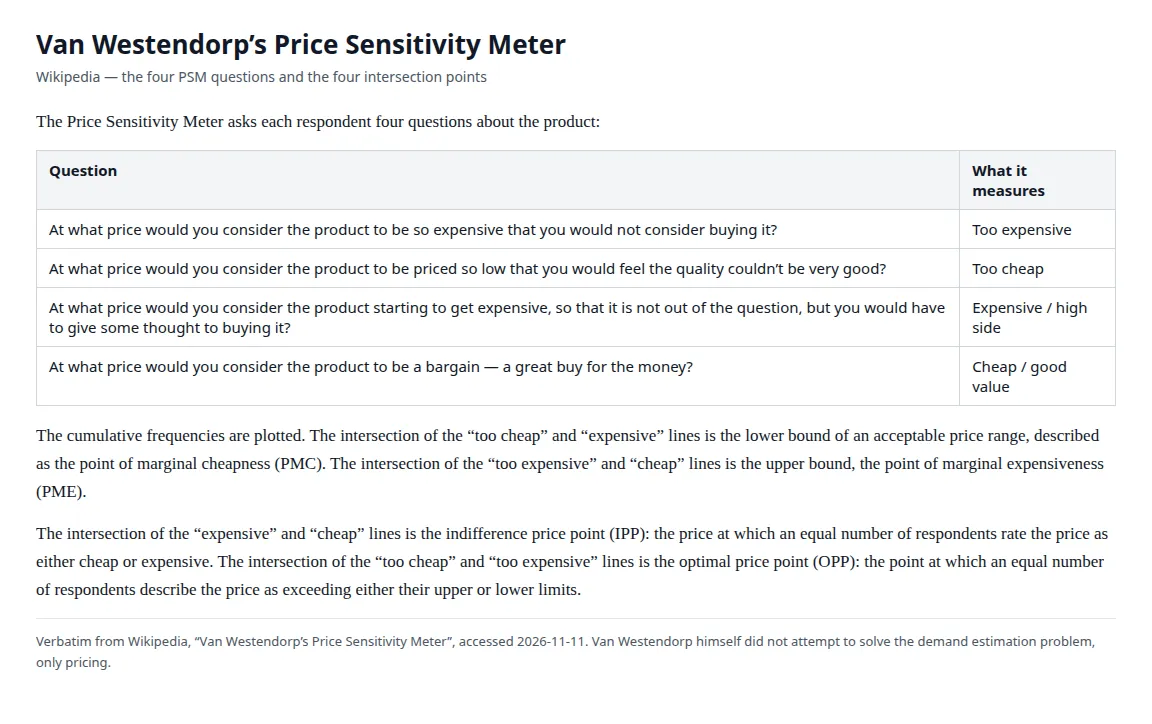
"Too cheap" crossing "expensive" is the point of marginal cheapness, the lower bound of the range. "Too expensive" crossing "cheap" is the point of marginal expensiveness, the upper bound. "Expensive" crossing "cheap" is the indifference price point. "Too cheap" crossing "too expensive" is the optimal price point. Van Westendorp himself did not claim the meter estimates demand — only the acceptable price range.
The survey below is an illustrative model, not a real study: 200 stated respondents answering the four questions at four price points.
| Price | Too cheap | Cheap | Expensive | Too expensive |
|---|---|---|---|---|
| 79 dollars | 42% | 78% | 8% | 1% |
| 99 dollars | 22% | 60% | 26% | 6% |
| 119 dollars | 10% | 40% | 48% | 10% |
| 139 dollars | 4% | 22% | 68% | 24% |
Read the crossings off the table. Too cheap meets too expensive at 119 dollars, where both are 10 percent — the optimal price point. Too cheap meets expensive between 79 and 99 dollars, at about 97 dollars — the point of marginal cheapness. Too expensive meets cheap between 119 and 139 dollars, at about 138 dollars — the point of marginal expensiveness. Cheap meets expensive between 99 and 119 dollars, at about 115 dollars — the indifference price point. The acceptable range is 97 to 138 dollars.
The margin-volume trade-off, with every number worked
On the Northwind model with a stated elasticity of 1.5, demand follows a constant-elasticity curve anchored on 1,000 users at 99 dollars. Competitors charge 89 to 129 dollars for comparable tools, a median of 109 dollars:
Monthly profit is contribution per user times users, minus fixed cost:
| Price | Users | Contribution per user | Monthly profit |
|---|---|---|---|
| 87.50 dollars (cost-plus) | 1,204 | 47.50 dollars | 27,166 dollars |
| 99.00 dollars (current) | 1,000 | 59.00 dollars | 29,000 dollars |
| 109.00 dollars (competitor median) | 866 | 69.00 dollars | 29,726 dollars |
| 119.00 dollars (Van Westendorp optimal) | 759 | 79.00 dollars | 29,946 dollars |
| 120.00 dollars (value-based) | 749 | 80.00 dollars | 29,947 dollars |
| 129.00 dollars | 672 | 89.00 dollars | 29,835 dollars |
Three things stand out. First, revenue falls as price rises while profit rises: at 120 dollars the business keeps 29,947 dollars, because each user contributes 80 dollars instead of 59 dollars. Second, the value-based price of 120 dollars and the Van Westendorp optimal point of 119 dollars agree to within a dollar. That agreement is the signal to trust. Third, the profit curve is flat near the top: 109 dollars earns 29,726 dollars and 129 dollars earns 29,835 dollars, so a small elasticity error does not wreck the decision. The cost-plus price is the outlier, 2,781 dollars a month below the best price.
Cut the price 10 percent, to 89.10 dollars, and volume rises to 1,171 users — but contribution per user falls to 49.10 dollars and profit falls to 27,507 dollars. To hold the original 59,000 dollars of contribution at 89.10 dollars, the business would need 1,202 users, a 20.2 percent gain from a 10 percent cut. A discount that does not bring that volume is a donation to the buyer. A 10 percent rise, to 108.90 dollars, can afford a volume fall of at most 14.37 percent: the new contribution of 68.90 dollars allows 856 users, down from 1,000. At elasticity 1.5 the rise actually draws 867 users and profit rises to 29,721 dollars. Run the break-even volume fall before any rise.
Tiering and anchoring: one price becomes three
Tiering gives the price-sensitive buyer a cheaper step and the heavy user a dearer one, and average revenue per user rises even when most buyers pick the middle tier. Northwind's stated tier model: Starter at 49 dollars, Growth at 119 dollars, Scale at 249 dollars, with a stated attach mix of 20, 55, and 25 percent.
Average revenue per user is 137.50 dollars against the single price of 99 dollars — 38.9 percent higher — and monthly revenue at 1,000 users is 137,500 dollars. The top tier does two jobs: it earns the most from the heaviest users, and it anchors the middle tier.
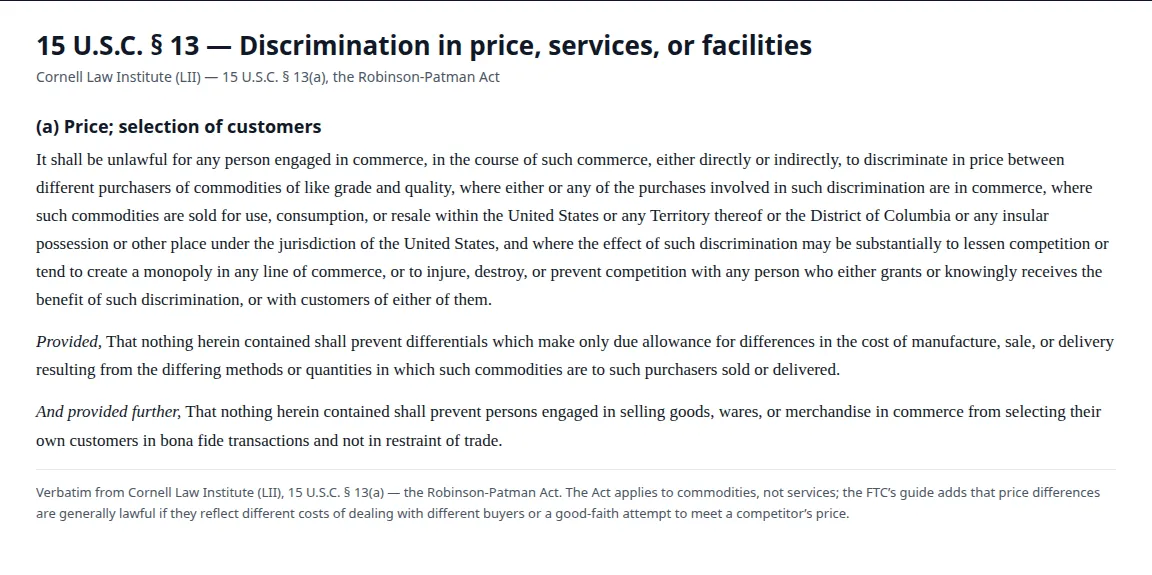
The price change itself: tell them before you charge them
A rise announced on the invoice is a breach of trust. A rise announced in advance, with the reason and the date, is a decision the customer can plan around. Run this sequence for any increase above 5 percent:
- Freeze the new price in writing: the number, the date, and who it applies to.
- Write one sentence of reason the buyer can repeat. If you cannot write that sentence, the price is not ready.
- Give 30 days' notice for monthly billing and 60 days for annual billing, in the channel the customer already reads.
- Grandfather existing annual customers to their next renewal.
- Offer a bridge: lock the old price for 12 months on an annual prepay.
- Brief support before the notice goes out.
- On the effective date, check the first 50 invoices by hand.
Price changes also touch the back office, where a sloppy rise becomes a real loss. The new price has to land in the billing system, the invoicing templates, and the revenue reports on the same day. A B2B SaaS company set up as an LLC and taxed as an S-Corp still invoices under its EIN, still recognizes the new price under GAAP as the subscription is delivered, and still needs its CPA to confirm the deferred revenue treatment before the first invoice goes out. Card payments clear through Stripe at 2.9 percent plus 30 cents a transaction, while ACH bank debits cost 0.8 percent capped at 5 dollars — on a 119 dollar invoice the card fee is 3.75 dollars and the ACH fee is 95 cents. Export the audit as a CSV, keep the PDF invoices, and push the new price through the billing API in one change; a C-Corp parent with a separate billing entity needs the same single change.
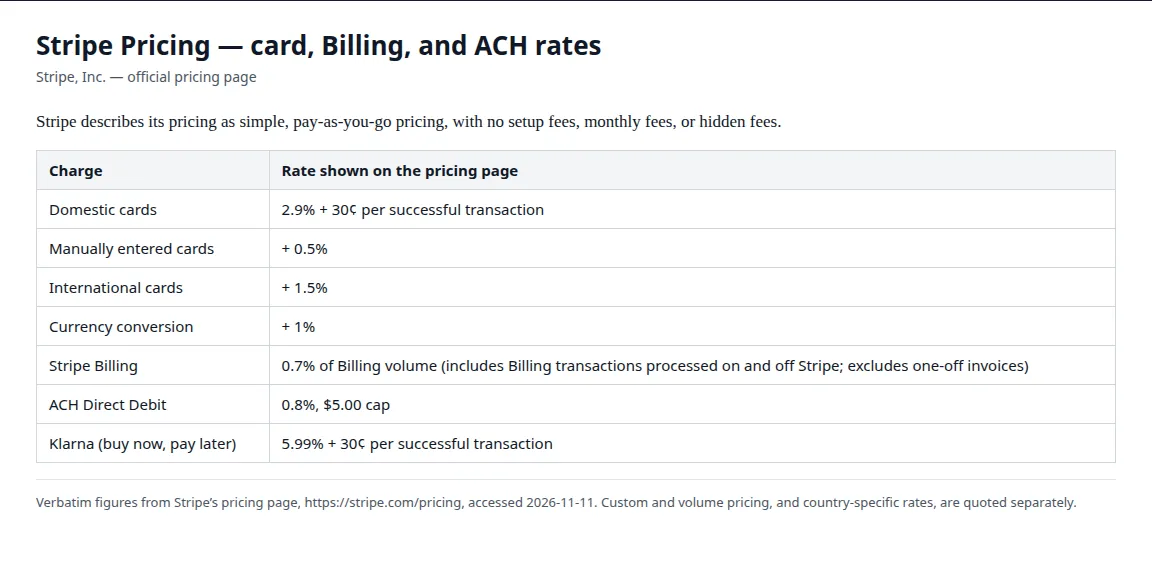
At 119 dollars the fees are small: the card fee is 3.75 dollars and Stripe Billing adds 83 cents, so the business keeps 114.42 dollars of the 119. At 99 dollars it keeps 95.14 dollars — the net gain from the rise is 19.28 dollars per user per month, not the full 20 dollars on the invoice.
Founder & CEO Insight — Enow A. Jovial
Set the price from value, check it against cost and competitors, and prove it with the table before you move. The break-even analysis and contribution margin playbook carries the cost-volume-profit math, the deferred revenue SaaS balance sheet recognition playbook covers how the new price is recognized month by month, and the profit calculator runs the arithmetic on your own numbers.