Break-Even Analysis and the Contribution Margin Playbook
Every owner eventually asks the same question in plain language: how much must I sell before I stop losing money? Break-even analysis answers it with a number, not a feeling. It takes three inputs — price, variable cost per unit, and fixed cost — and returns the exact sales volume where profit is zero. Below that volume the business burns cash; above it, every sale adds its contribution margin to profit.
What break-even analysis actually measures
Break-even analysis isolates the point where total revenue equals total cost. The engine inside it is contribution margin: the dollars left from each sale after paying the costs that vary with that sale. Contribution margin per unit is price minus variable cost per unit. The contribution-margin ratio is that margin divided by price: the cents of each revenue dollar available to cover fixed cost and then profit.
Who this is for, and who should avoid it
This playbook is for an owner-operator who sets prices, signs leases, and hires staff — a founder of an LLC or S-Corp, a sole proprietor with an EIN, a finance lead at a small C-Corp. It assumes you can list your costs and know which ones move with volume, and it fits businesses with a stable price and cost structure over a month or a quarter.
Do not use it as your only planning tool if your price changes every week, as with a commodity trader — the break-even point will move faster than the plan.
Step one: separate fixed from variable costs honestly
Every break-even number downstream depends on this split, and it is where most models quietly fail. A fixed cost does not change with volume inside the relevant range: rent, salaried staff, insurance, software subscriptions, depreciation. A variable cost changes with each unit sold: raw materials, packaging, direct labor, processing fees, shipping. Between them sit semi-variable costs, such as a phone plan with a base fee plus per-minute charges — split these into both parts.
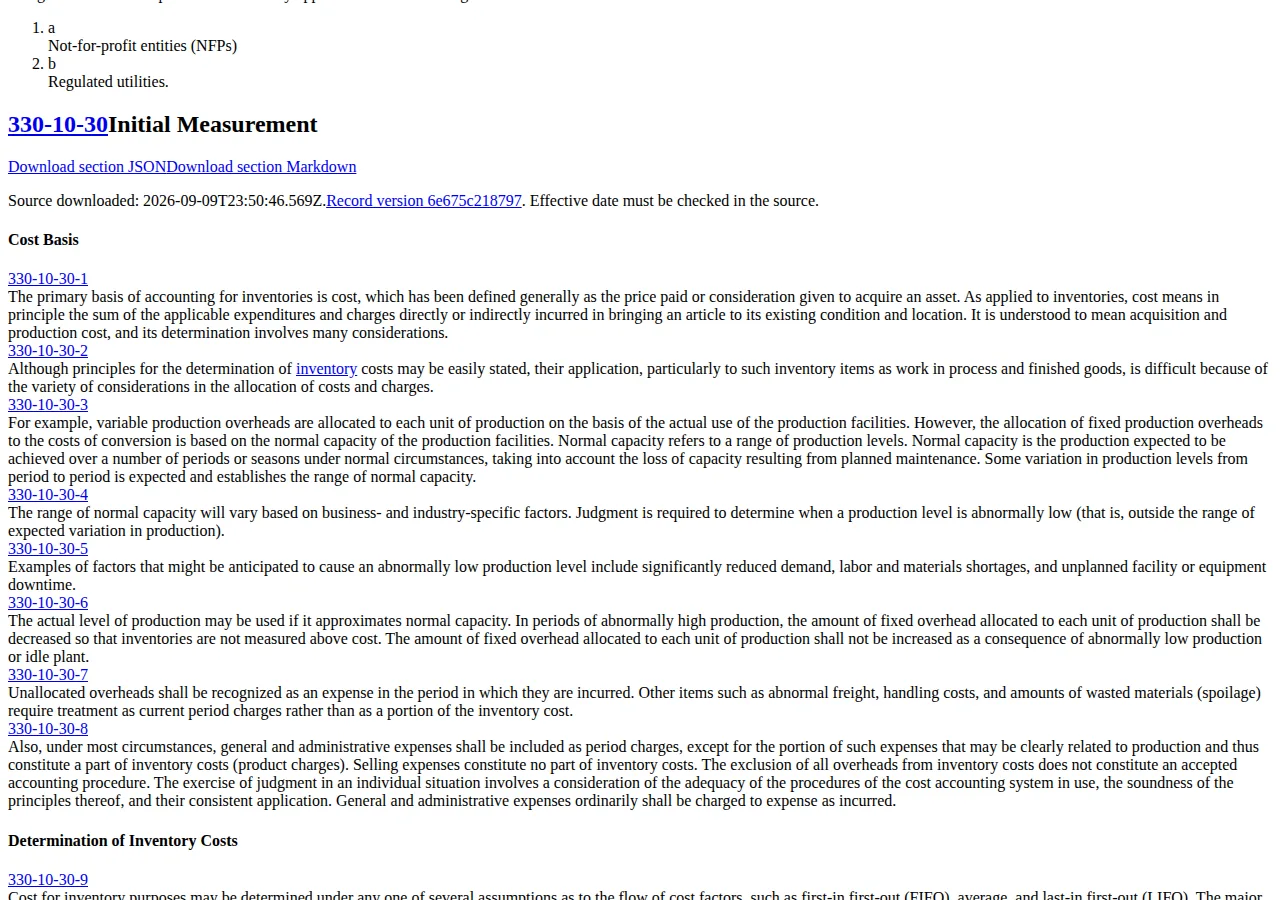
Under GAAP, FASB ASC 330-10-30-3 requires variable production overhead to be allocated on actual use of production facilities, while fixed production overhead is allocated "based on the normal capacity of the production facilities." Unallocated overhead is expensed in the period incurred (ASC 330-10-30-7), and selling expenses are never part of inventory cost (ASC 330-10-30-8). So the break-even "fixed" bucket and the GAAP inventory bucket are different objects.
| Cost | Break-even | GAAP | Authority |
|---|---|---|---|
| Direct materials and labor | Variable | Product cost in inventory | ASC 330-10-30-1 |
| Variable production overhead | Variable | Product cost, on actual use | ASC 330-10-30-3 |
| Fixed production overhead | Fixed | Product cost, on normal capacity | ASC 330-10-30-3 |
| Selling expenses | Fixed (period) | Period charges, never inventory | ASC 330-10-30-8 |
| General and administrative | Fixed (period) | Period charges, except the portion clearly related to production | ASC 330-10-30-8 |
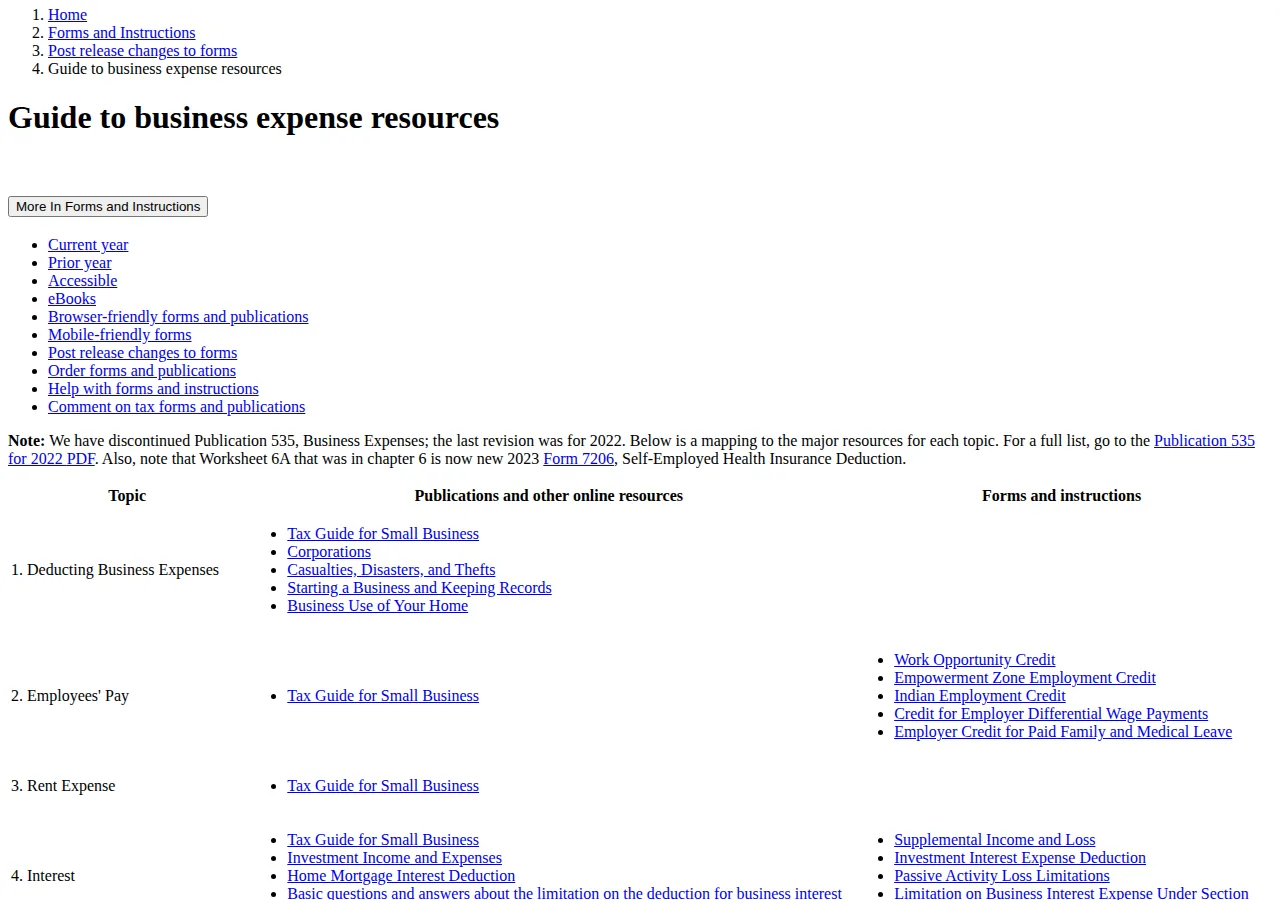
The tax side adds a second divergence. IRC section 162(a) allows a deduction for "all the ordinary and necessary expenses paid or incurred during the taxable year in carrying on any trade or business," which covers rent and salaries as they are paid. But IRC section 263A requires producers and resellers to include direct costs plus "such property's proper share of those indirect costs" in inventory, so part of a cost your model treats as immediate may only become deductible when the goods sell. A sole proprietor pays self-employment tax under SECA; an S-Corp owner pays FICA on a reasonable salary.
The single-product break-even, worked in full
Harbor Roast is an illustrative coffee roaster with stated inputs — not a real company's results. Price is $24.00 per bag; variable cost $9.00 (coffee $4.50, packaging $1.50, labor $2.00, shipping $1.00); fixed cost $18,000 per month (rent $6,000, salaries $8,000, insurance $1,500, software $1,000, depreciation $1,500).
Contribution margin per unit is $24.00 minus $9.00, or $15.00. The ratio is $15.00 divided by $24.00, or 62.5 percent. Break-even units are $18,000 divided by $15.00, or 1,200 bags per month. Break-even revenue is $18,000 divided by 0.625, or $28,800 — the same as 1,200 bags times $24.00.
At 1,800 bags, revenue is 1,800 times $24.00, or $43,200; variable cost is 1,800 times $9.00, or $16,200; profit is $43,200 minus $16,200 minus $18,000, or $9,000. Check your own numbers in the break-even calculator.
Margin of safety: how far you are from the floor
Margin of safety is the distance between actual sales and break-even sales: in dollars, actual revenue minus break-even revenue; in percent, that distance divided by actual revenue. For Harbor Roast at 1,800 bags, it is $43,200 minus $28,800, or $14,400 — 33.3 percent of revenue. Sales can fall by one third before the business starts losing money.
Multi-product break-even: the weighted average
Most businesses sell more than one product. The weighted-average method blends them using the sales mix — the share of total units each product represents. Harbor Roast adds a brewing kit at $40.00 with $22.00 variable cost, and a sample pack at $12.00 with $4.00 variable cost. The mix is 50 percent bags, 30 percent kits, 20 percent sample packs, and fixed cost is $29,000 per month.
| Product | Price | Variable cost | CM per unit | CM ratio | Sales mix |
|---|---|---|---|---|---|
| A — whole-bean bag | $24.00 | $9.00 | $15.00 | 62.5% | 50% |
| B — brewing kit | $40.00 | $22.00 | $18.00 | 45.0% | 30% |
| C — sample pack | $12.00 | $4.00 | $8.00 | 66.7% | 20% |
Weighted-average contribution margin per unit is 0.50 times $15.00 plus 0.30 times $18.00 plus 0.20 times $8.00, or $14.50. Weighted-average price is $26.40, and the weighted ratio is $14.50 divided by $26.40, or 54.9 percent. Break-even is $29,000 divided by $14.50, or 2,000 units — 1,000 bags, 600 kits, 400 sample packs. Break-even revenue is 2,000 times $26.40, or $52,800.
The mix is the trap. If the mix shifts to 30 percent bags, 50 percent kits, and 20 percent sample packs, the weighted contribution margin rises to $15.10 and break-even falls to 1,921 units, because the kit carries the largest dollar margin per unit even though its ratio is the lowest. The ratio decides break-even revenue; the dollar margin decides break-even units.
Operating leverage: why volume swings hurt more above the floor
Operating leverage measures how sensitive profit is to a change in sales. Degree of operating leverage equals total contribution margin divided by operating income. At 1,800 bags, contribution is 1,800 times $15.00, or $27,000, and profit is $9,000, so leverage is 3.0 times: a 10 percent rise in volume lifts profit by about 30 percent. At 2,400 bags, contribution is $36,000, profit is $18,000, and leverage falls to 2.0 times.
Leverage is highest just above break-even and falls as volume grows, so lower fixed cost before chasing volume when leverage is above 3.0 times: a 10 percent sales miss cuts profit by 30 percent. See the cash conversion cycle playbook for how slow customer payments stretch the same exposure.
Cash break-even: the number that keeps the doors open
Accounting break-even includes non-cash fixed costs, above all depreciation. Cash break-even strips them out, because depreciation never writes a check. Harbor Roast's fixed cost is $18,000 per month, of which $1,500 is depreciation, so cash fixed cost is $16,500. Cash break-even is $16,500 divided by $15.00, or 1,100 bags, and cash break-even revenue is 1,100 times $24.00, or $26,400 — 100 bags below the accounting break-even of 1,200.
The Adobe case: reading a real 10-K cost structure
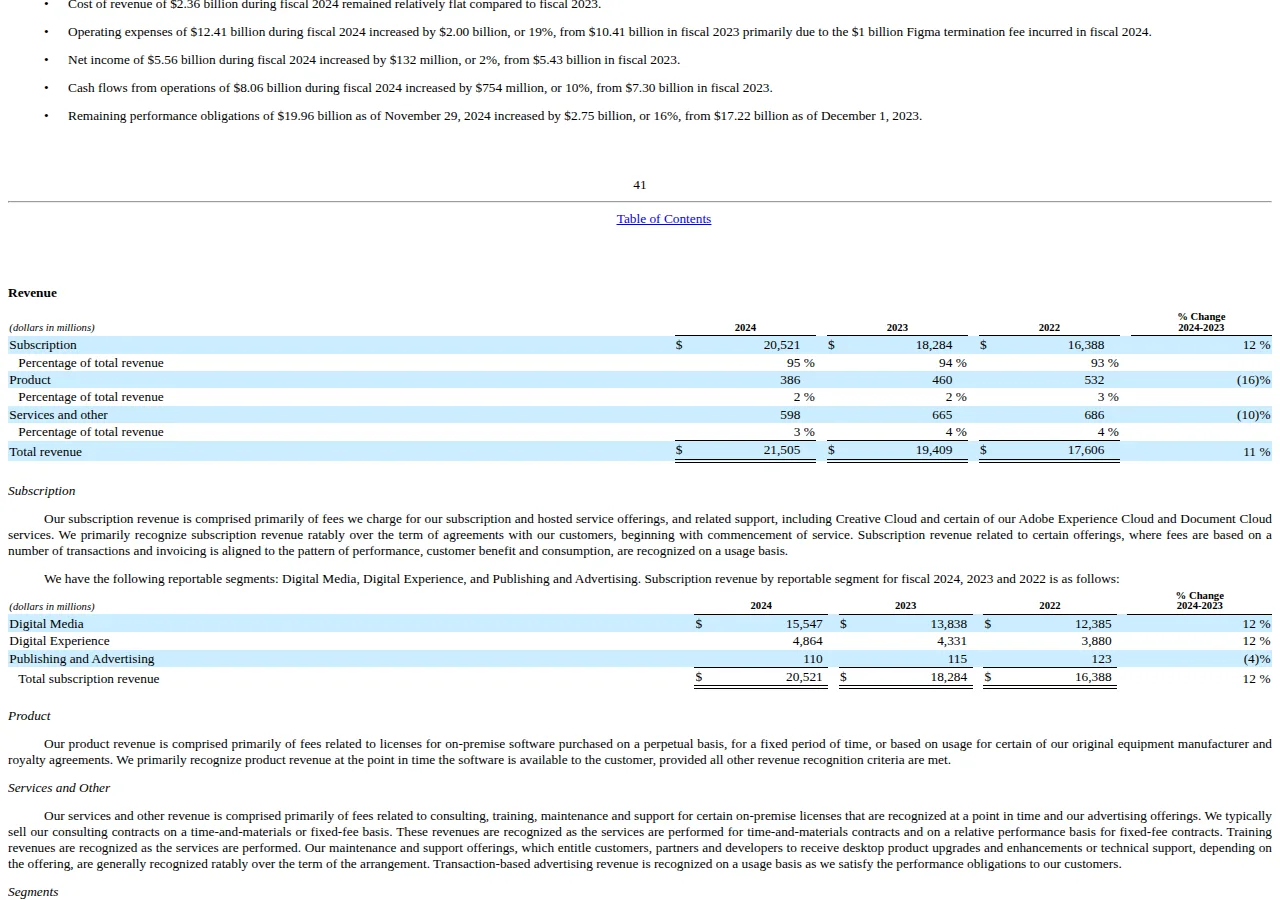
Real filings do not label costs fixed or variable. Adobe Inc.'s Form 10-K for the fiscal year ended November 29, 2024, filed with the SEC on January 13, 2025, shows how a real filer draws the lines. Total revenue was $21,505 million — subscription $20,521 million, product $386 million, services and other $598 million. Total cost of revenue was $2,358 million, leaving gross profit of $19,147 million, a gross margin of 89.0 percent.
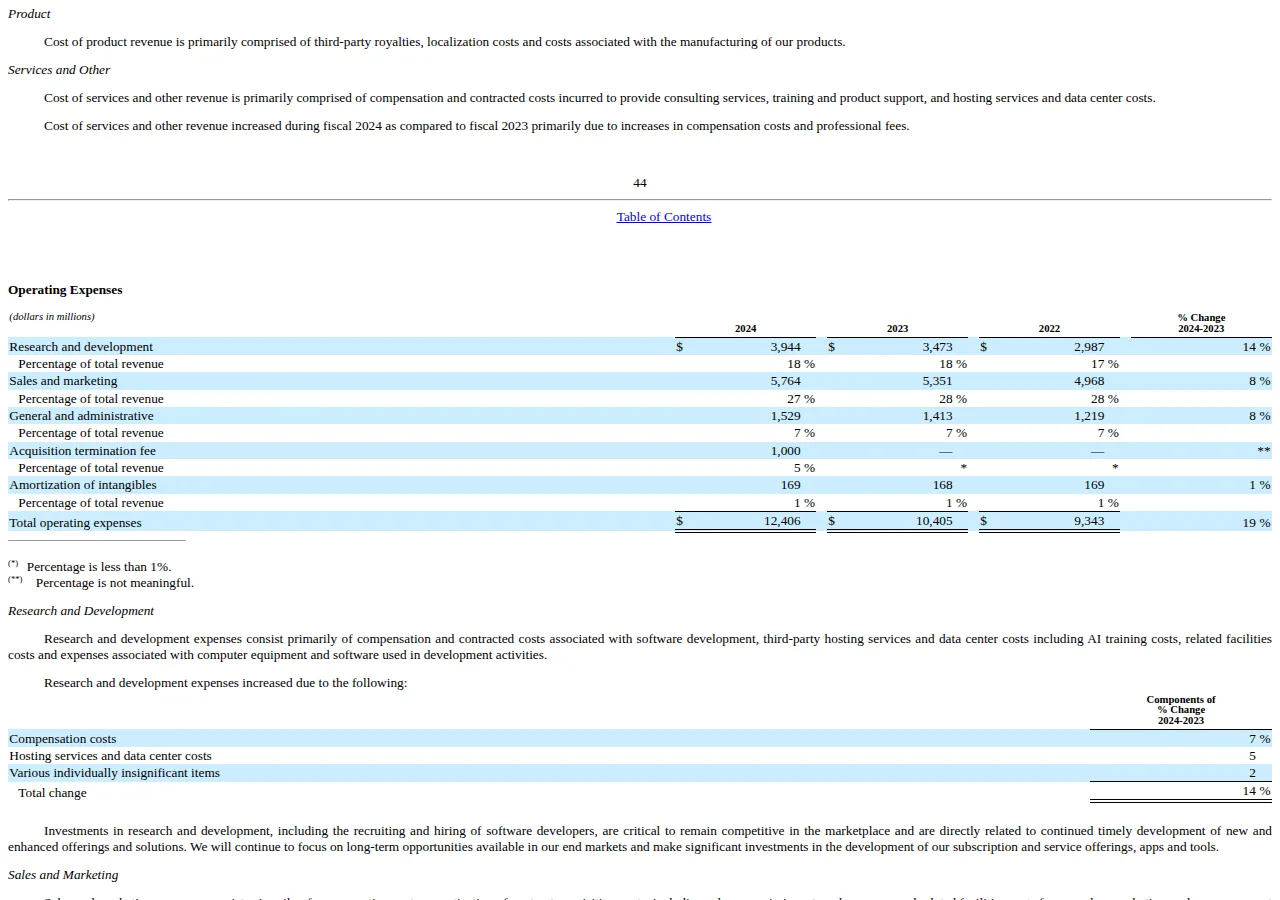
Operating expenses were $12,406 million: research and development $3,944 million (18.3 percent of revenue), sales and marketing $5,764 million (26.8 percent), general and administrative $1,529 million (7.1 percent) — plus two lines no break-even model should treat as recurring fixed cost: a $1,000 million acquisition termination fee for the Figma deal and $169 million of amortization of intangibles. Operating income was $6,741 million, a 31.3 percent margin.
Three lessons carry over. First, segment margins differ sharply: subscription 91.2 percent gross margin, products 93.5 percent, services only 10.7 percent. Second, the $1,000 million termination fee is 4.6 percent of revenue and 14.8 percent of operating income; a model built on that year without removing the one-off charge would overstate the fixed-cost base by a full billion dollars. Third, the 10-K never states which costs are fixed and which are variable. Anyone who claims to have computed Adobe's break-even point from the filing alone is guessing. The same discipline applies in the SaaS unit economics playbook.
Founder & CEO Insight — Enow A. Jovial
Which break-even variant to use, and when
| Variant | Question it answers | Use it when | Authority |
|---|---|---|---|
| Unit break-even | Units before profit? | Single product, stable price | CM formula |
| Revenue break-even | Revenue before profit? | Services, projects, mixed pricing | CM ratio |
| Weighted multi-product | Volume across the mix? | Two or more products, known mix | Weighted-average CM |
| Operating leverage | How much does profit swing? | Deciding on adding fixed cost | DOL formula |
| Cash break-even | Can we pay the bills? | Payroll week, low cash reserve | Cash fixed cost only |
| GAAP / tax view | Deductible, and when? | Inventory, commissions, year-end | ASC 330, ASC 340-40, IRC §162, §263A |
Execution checklist: run your break-even in one sitting
- List every cost. Pull three months of bank and card statements. Tag each line fixed, variable, or semi-variable.
- Set price and variable cost per unit. Use the price you charge and the variable cost from your latest invoices.
- Compute contribution margin and the ratio. Price minus variable cost per unit, then divide by price.
- Compute break-even units and revenue. Fixed cost divided by contribution margin per unit, and fixed cost divided by the ratio.
- Compute margin of safety at current volume. Actual revenue minus break-even revenue, in dollars and in percent.
- Strip non-cash fixed cost for cash break-even. Remove depreciation and amortization from fixed cost and recompute.
- Stress the model. Recompute with price down 10 percent and the mix shifted toward your lowest-margin product.
- File the assumptions. One page: price, variable cost build, fixed-cost list, mix, date.
- [x] Fixed-versus-variable split documented line by line, with semi-variable costs split
- [x] Contribution margin, ratio, break-even units, and break-even revenue computed and cross-checked
- [x] Margin of safety recorded in dollars and percent at current volume