A sales pipeline is not a forecast, and a forecast is not a CRM. The pipeline is the deals that could close in a period, at their values, at their stages. The forecast is what you expect to close. The CRM is the database that holds both. Confuse the three and you will report a big number on Monday and miss the quarter on Friday — because a pipeline stuffed with dead deals, stale stages, and unqualified names is not coverage, it is a comfort blanket with a dollar sign on it.
The number that matters on Monday morning is coverage: the total value of open pipeline divided by the quota for the same period. If your team has a $1 million quarterly target and $3 million of open deals, coverage is 3x. That single ratio answers the only question that matters before the quarter starts: do you have enough deals in play, even after some slip, stall, or go dark? Because they will — deals slip, decision-makers go quiet, budgets freeze — and the ratio exists to account for that before it becomes a problem.
The seven stages, and what moves a deal from one to the next
Close's pipeline guide traces stage thinking to John H. Patterson's 1887 sales system at National Cash Register, and divides the modern cycle into seven stages. The stages are the same across B2B SaaS teams; what differs is the exit criterion — the fact a rep must be able to state before the deal is allowed to move.
Prospecting is lead generation through cold calling, email, and search. Qualification is prospect evaluation: the bad fits must be removed early, before they consume meetings. Initial Contact is the first real conversation, usually by phone or email. Meeting/Demo is where the prospect learns the product. Needs Analysis is where the rep learns what the prospect actually needs. Close is the decision: buy or walk away. Follow-Up is what happens after the first sale — onboarding, referrals, and the next sale.
Each stage needs a measured conversion rate, not a guess: the percentage of prospects that become qualified, of qualified prospects that take a meeting, of meetings that become proposals, of proposals that close. Those four numbers are the pipeline's vital signs. A team that does not know them cannot forecast, cannot hire, and cannot tell whether a bad month is a pipeline problem or a closing problem.
| Stage | Exit criterion | What it proves |
|---|---|---|
| Prospecting | A named person at a named company, in the ICP | The top of the funnel is real people |
| Qualification | Budget, authority, need, and timeline confirmed | The deal can close this period |
| Initial Contact | A conversation happened, not a voicemail | The prospect is reachable |
| Meeting / Demo | The prospect saw the product and stayed | Interest survived contact with reality |
| Needs Analysis | The pain is written down in the prospect's words | The sale solves a named problem |
| Close | Signed order or a clean, dated loss | The pipeline tells the truth |
| Follow-Up | Onboarding complete, referral asked | The first sale becomes the second |
Coverage: the ratio, the benchmark, and the correction
The formula is one division.
The most commonly cited benchmark is 3x: three dollars of pipeline for every dollar of quota. The logic is arithmetic — 3x is the inverse of a 33% win rate. Vetta's guide states it plainly: a $2.4 million open pipeline against an $800,000 quarterly quota is 3x, and the right target for any team is the inverse of its own win rate.
That correction is the whole article in one line. A team closing 50% of qualified opportunities needs 2x. A team closing 40% needs 2.5x. A team closing 33% needs 3x. A team closing 25% needs 4x. A team closing 20% needs 5x. Adopt 3x without checking your win rate and you have imported someone else's win rate into your forecast — and at a 21% win rate the arithmetic says you need 1 ÷ 0.21, about 4.8x, to have a realistic shot at quota. By stage: early teams target 4–5x until win-rate data accumulates; growth teams with a year of history target 3–4x; mature orgs with predictable win rates run 2.5–3x.
The worked example: from quota to prospect list
Take a constructed illustration: a B2B SaaS team with a $120,000 quarterly quota, a 25% win rate on qualified opportunities, a $6,000 average deal size, and a funnel converting 40% of meetings into qualified opportunities and 50% of prospects into meetings. The arithmetic runs backwards from the quota to the prospect list.
The funnel is 400 prospects, 200 meetings, 80 qualified opportunities, 20 closed deals — and 20 × $6,000 is exactly the $120,000 quota. Change one input and the whole funnel moves: a 25% to 33% win rate cuts the pipeline from $480,000 to $360,000 and the prospect list from 400 to 300; a $6,000 to $8,000 average deal cuts qualified opportunities from 80 to 60. That is why coverage is a management tool, not a vanity metric: it prices each lever in advance.
Run the same funnel through the ROI calculator before the quarter starts: the cost of generating 400 prospects, at your real CAC, against the $120,000 of revenue they are expected to produce, is the first honest check on whether the quarter is worth pursuing. A pipeline that costs more to fill than the quota is worth is not a pipeline; it is a loss booked in advance.
Velocity: how fast the money moves
Coverage answers whether you have enough. Velocity answers how fast it arrives. Pipedrive's guide gives the formula and the worked example, and every input is a lever a founder controls.
Pipedrive's example: 30 deals in the pipeline with an average deal size of $5,000, a deal close rate of 50%, and 75 days to turn a qualified lead into a paying customer. Thirty times $5,000 is $150,000; times 50% is $75,000; divided by 75 days is $1,000 a day. On any given day, that team has $1,000 worth of sales speeding through its pipeline.
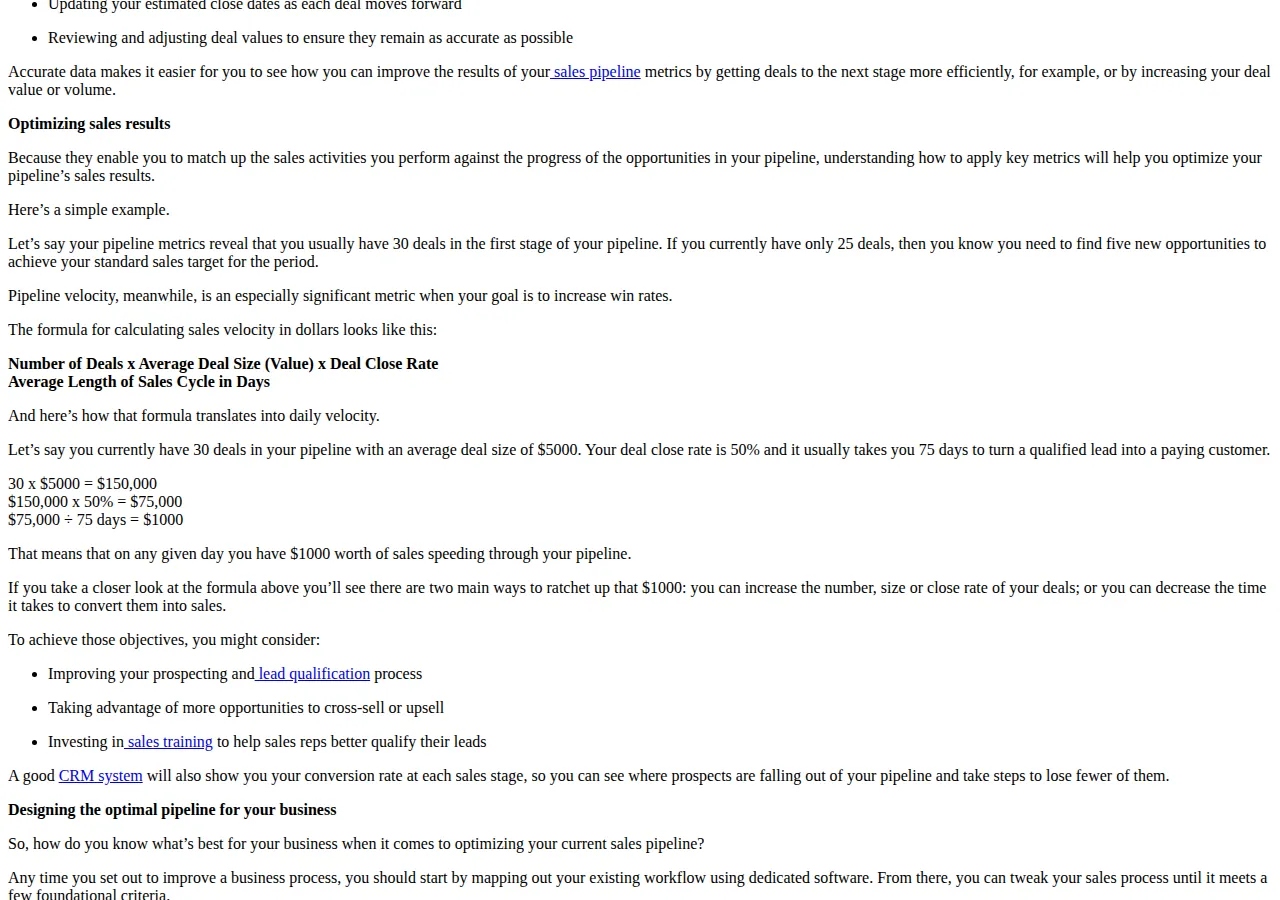
The formula shows exactly two ways to raise the number: increase the numerator — more deals, bigger deals, a higher close rate — or decrease the denominator, the days a deal takes to close. Shortening the cycle from 75 days to 60 days lifts the same pipeline from $1,000 a day to $1,250 a day without a single new prospect. That is why cycle length is the cheapest lever in the pipeline: it costs no advertising, no headcount, and no discounting — only the discipline of moving a deal to the next stage on the day it is ready.
Coverage without velocity is a big number that arrives too late. Velocity without coverage is a fast number that runs out. The founder's Monday check is two numbers, not one: coverage at or above the win-rate-derived target, and velocity at or above the daily rate the quarter requires. The worked example above needs $120,000 over 90 days — $1,333 a day — so a velocity of $1,000 a day is already a warning, even before coverage is checked.
Weighted pipeline: the number that tells the truth
Unweighted coverage counts every deal at full face value. Weighted coverage applies a probability multiplier by stage: a proposal-stage deal might carry 60% while an early discovery opportunity carries 20%. The weighted sum is more conservative and usually more accurate, and most CRM systems calculate it automatically. A pipeline that shows 4x unweighted and 2.4x weighted is not a 4x pipeline; it is a 2.4x pipeline with $1.6x of hope in it.
The weighted pipeline is also the forecast. Add the weighted values of the deals expected to close in the period and you have the forecast; compare it to the actuals at quarter-end and you have forecast accuracy, the metric that tells you whether the pipeline process works or merely looks busy. Teams that manage stages, conversion rates, velocity, and weighted value forecast better than teams that merely count deals.
The hygiene cadence keeps the weighted number honest. Every deal gets a next step with a date — a deal with no next step is a dead deal wearing a live stage. Every deal older than the average cycle length gets a review: advance it, requalify it, or close it as lost. Every lost deal gets a reason code, because the reason codes are the training data for the next quarter's qualification criteria. A pipeline that is never cleaned grows by exactly the number of dead deals in it, and its coverage ratio grows with them.
The pipeline sequence: three phases, one operating rhythm
Phase 1 — Define the stages and the probabilities. Write the seven stages with exit criteria, as above, and assign a probability to each stage from your own closed-deal history, not from a template: what percentage of deals at each stage actually closed over the last four quarters. Set the required coverage from the win rate — 1 ÷ win rate — and publish both numbers where the team can see them. Define the ICP in writing, because qualification against an unwritten ICP is a matter of opinion, and opinions do not survive the end of the quarter.
Phase 2 — Build the funnel backwards. Start from the quota, apply the coverage target, divide by average deal size for the qualified opportunities, then divide by each stage conversion rate until you reach the prospect count. That count is the top-of-funnel target for the period. Price it: the CAC of generating those prospects, the MRR and ARR they are expected to produce, and the LTV against the CAC. A funnel whose CAC exceeds its LTV is not a growth plan. Price the system with the HubSpot vs Salesforce vs Pipedrive CRM pricing guide, the top of the funnel with the LinkedIn Ads vs Google Ads lead-cost playbook, the paid side with the Google Performance Max vs Search ROAS playbook, and the outreach with the Salesloft vs Outreach vs Apollo engagement guide.
Phase 3 — Run the weekly cadence. Monday: coverage and velocity, unweighted and weighted, against the targets. Wednesday: stage-by-stage conversion for the week, and every deal past its average cycle length reviewed. Friday: next steps dated on every open deal, and the forecast restated from the weighted pipeline. A pipeline reviewed once a month is a report; reviewed three times a week, it is a management system. Keep the data in one CRM — the API sync, the SQL reporting, and the stage history only exist if the system of record is one system.
- [x] Phase 1: Define stages and probabilities — seven stages with exit criteria, probabilities from your own last four quarters, required coverage set at 1 ÷ win rate, ICP written down.
- [x] Phase 2: Build the funnel backwards — quota to pipeline to opportunities to meetings to prospects; price it with real CAC, MRR, ARR, and LTV.
- [x] Phase 3: Run the weekly cadence — Monday coverage and velocity, Wednesday stale-deal review, Friday forecast restated from the weighted pipeline.
- [x] Clean weekly — no next step, no stage; no activity in 90 days, no longer in the numerator; every loss coded with a reason.
- [x] Check both numbers — coverage at or above the win-rate target, and velocity at or above the daily rate the quarter requires.
The failure modes, named in advance
The first is the vanity pipeline: dead deals left in the numerator because nobody wants to call them lost. The second is stage inflation: deals advanced to flatter the forecast, so the weighted pipeline is built on probabilities the deals never earned. The third is coverage without velocity: a 5x pipeline with a 120-day cycle that cannot deliver inside the quarter. The fourth is the tool fallacy: buying a CRM and calling it pipeline management. The CRM holds the data; the stages, the conversion rates, the probabilities, and the cadence are the management, and no software ships with them. The fifth is the NRR blind spot: a team that counts only new logos and ignores expansion and churn will forecast the quarter while the base quietly shrinks.
Founder & CEO Insight — Enow A. Jovial
A pipeline has four measurable parts — stages, conversion rates, coverage, and velocity — and a founder who measures all four knows on the first Monday whether the number is reachable, and which lever to pull if it is not. Build it backwards from the quota, weight it by stage, clean it weekly, and let the arithmetic, not the optimism, set the forecast.