OpenTelemetry Collector vs Datadog Agent vs Grafana Alloy: the Observability Pipeline Playbook
Every service emits traces, metrics, and logs — and something has to carry them to the backend. That carrier is the pipeline, and the pipeline is a product decision: it decides what you pay per gigabyte, which traces survive sampling, and how hard it is to leave your vendor. Three carriers dominate the decision: the OpenTelemetry Collector, the Datadog Agent, and Grafana Alloy. The observability pricing playbook prices the backends; this playbook compares the pipelines.
The OpenTelemetry Collector: receivers, processors, exporters, pipelines
The OpenTelemetry Collector is, in its own documentation's words, a vendor-agnostic way to receive, process, and export telemetry data. It removes the need to run, operate, and maintain multiple agents and collectors, and it supports open-source formats such as Jaeger, Prometheus, and Fluent Bit, sending to one or more open-source or commercial backends. It is a single codebase deployable as an agent or a collector, handling traces, metrics, and logs.
The architecture has four component types. Receivers take data in — the OTLP receiver accepts traces, metrics, and logs over gRPC and HTTP. Processors transform data in flight: batching, filtering, sampling, and memory protection. Exporters send data out: OTLP, Prometheus, Jaeger, and vendor endpoints. Connectors join pipelines, letting the output of one pipeline feed another. Components are wired into pipelines under the service section, one pipeline per signal.
Two processors deserve attention before any other. The batch processor groups spans, metrics, and log records into fewer, larger export requests — the single largest lever on export cost and backend load. The memory limiter protects the Collector from the workload it carries: the configuration example in the Collector documentation sets check_interval to 5s, limit_mib to 4000, and spike_limit_mib to 500, so the Collector starts shedding load past 4,000 MiB and tolerates 500 MiB spikes.
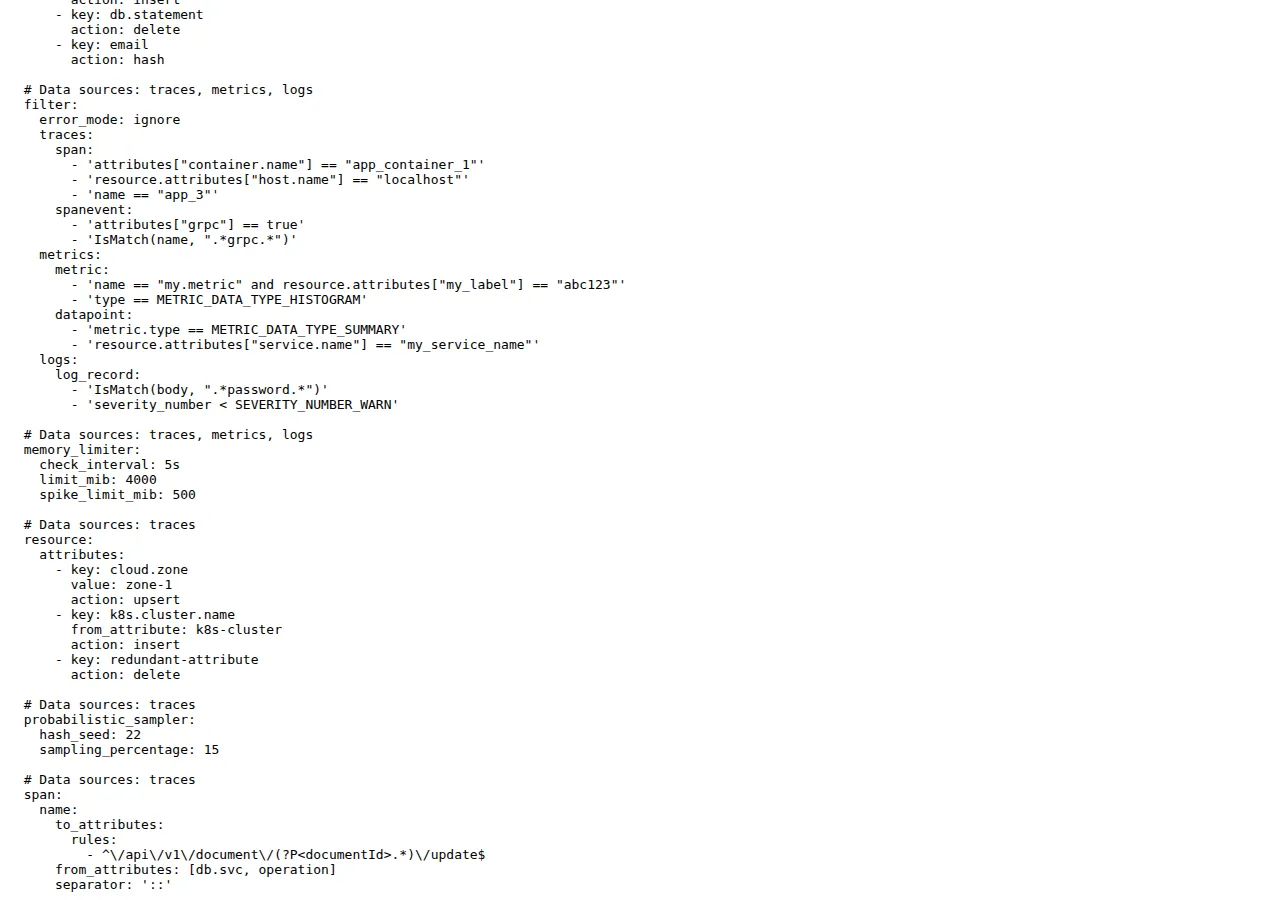 A pipeline without a memory limiter trusts every client to behave. The Collector documentation recommends a collector alongside services even for small setups, because it lets the service offload data quickly while the collector handles retries, batching, and filtering.
The Datadog Agent: one agent per host, three ingestion routes
The Datadog Agent takes the opposite approach: a per-host agent that collects infrastructure metrics, logs, and traces, receives custom metrics over DogStatsD, and runs hundreds of integrations pulling data from databases, queues, and cloud services. It is installed on every host and priced per host, which makes the bill easy to forecast and hard to shrink: the Agent's price follows the fleet, not the telemetry volume. The Agent documentation also describes an OTLP endpoint inside the Agent, so OTel-instrumented services can send traces to the host Agent without a separate Collector.
Datadog documents three routes for OpenTelemetry data: the DDOT Collector, Datadog's own distribution of the OpenTelemetry Collector; the upstream OpenTelemetry Collector, configured with a Datadog exporter; and Direct OTLP Ingest, which accepts OTLP data without any collector at all. Direct OTLP Ingest has no collector to operate but no place to batch, filter, or sample before the meter runs; the DDOT Collector adds a component to operate but gives you the full OTel pipeline before Datadog's ingest meter sees a byte. The LLM observability cost playbook prices the tracing bill for AI workloads that feed the same pipeline.
Grafana Alloy: the Collector, configured in River
Grafana Alloy is an open-source OpenTelemetry Collector distribution with built-in Prometheus pipelines and support for metrics, logs, traces, and profiles: the Collector, plus Prometheus-native collection, plus Grafana's ecosystem, in one binary. It is configured in River, an expression-based language, where each pipeline stage is a component with a type, a label, and arguments referencing other components:
A minimal Alloy pipeline wires otelcol.receiver.otlp (127.0.0.1:4317) into otelcol.processor.batch, then into an otelcol.exporter.otlp.
The component model is the difference that matters. In the Collector's YAML, a pipeline lists component names and the wiring is positional; in Alloy's River, each component declares its outputs explicitly, so the pipeline is a graph you can read, and a miswired reference fails at load time instead of silently dropping a signal. Alloy adds clustering for automatic workload distribution, modules for sharing pipelines, remote configuration, and a built-in UI for debugging. Components exist for the OpenTelemetry Collector, Prometheus, Loki, and Pyroscope, and Alloy can export to other vendors' backends, not only Grafana Cloud. The error-tracking pricing comparison covers the adjacent bill for exceptions, which Alloy does not collect.
The decision table
| Question | OpenTelemetry Collector | Datadog Agent | Grafana Alloy |
|---|---|---|---|
| What it is | Neutral telemetry pipeline | Per-host agent for metrics, logs, traces | OTel Collector distribution with Prometheus pipelines |
| Configuration | YAML pipelines | Agent config plus integrations | River components with explicit outputs |
| Signals | Traces, metrics, logs | Metrics, logs, traces, profiles, DogStatsD | Metrics, logs, traces, profiles |
| Backends | Any OTLP target | Datadog (primarily) | Grafana Cloud or any OTLP target |
| Sampling | Head and tail sampling | Ingestion sampling at the backend | Same OTel processors |
| Scaling unit | Collector instances | Hosts | Alloy instances, clustered |
| Lock-in | None by design | High: agent, backend, billing are one product | Low: open source, big-tent exports |
| Authority | opentelemetry.io/docs/collector | docs.datadoghq.com/agent | github.com/grafana/alloy |
Worked math 1: the Datadog bill for a 20-host fleet
Take a hypothetical fleet: 20 hosts, 50 services, generating 100 GB of ingested spans per day. All rates below are Datadog list prices read from datadoghq.com/pricing on 14 November 2026, billed annually. Infrastructure Monitoring Pro costs $15 per host per month, and APM costs $31 per host per month with Infrastructure Monitoring attached ($36 standalone):
Datadog includes 150 GB of ingested spans per APM host, summed across all APM hosts. At 100 GB per day, the fleet generates 3,000 GB per month:
The allowance exactly covers the volume, so the overage at $0.10 per GB is $0. Indexed spans are the second meter: Datadog includes 1 million indexed spans per APM host at 15-day retention, summed across hosts, and charges $1.70 per million beyond the allowance, billed annually. This playbook assumes 30 million spans generated per month and 10 percent indexed — 3 million indexed spans — inside the 20-million allowance, so the indexed charge is $0. Run the same fleet through our ROI Calculator to compare the pipeline's cost against the incident time it saves:
Worked math 2: what tail sampling actually saves
Tail sampling decides which traces to keep after the whole trace has arrived, so it can keep every error and a thin slice of healthy traffic. Take the same fleet: 30 million spans per month, 2 percent from error traces. The policy keeps 100 percent of error traces and 5 percent of healthy traces:
Only 6.9 percent of spans survive. Ingested volume falls from 3,000 GB per month to 207 GB per month:
Indexed spans fall in the same proportion, from 3 million to 207,000 per month:
At the fleet's current volume the saving is $0 — the 3,000 GB ingest allowance and the 20-million indexed-span allowance already cover the unsampled volume. The saving becomes real when volume escapes the allowance: at 200 GB per day the fleet generates 6,000 GB per month, and the overage without sampling is (6,000 − 3,000) × $0.10 = $300 per month, while with sampling the ingested volume is 6,000 × 0.069 = 414 GB, inside the allowance. Sampling pays when volume grows past the allowance, not before. It also costs memory: the processor is stateful, so it belongs on a gateway Collector with a memory limiter.
Worked math 3: the Grafana metrics leg, and what could not be verified
Grafana Cloud Pro charges a $19 per month platform fee including 10,000 active series, then $6.50 per 1,000 series, with 13 months of retention for metrics and 30 days for logs, traces, and profiles. Take an estate with 25,000 active series:
That is the metrics leg only. Grafana's per-GB log and trace ingestion rates sit behind its pricing calculator, and the pricing page read today did not expose them as verifiable text — so this playbook does not print them. Do not budget a Grafana log or trace bill from a rate you have not read on the day you buy.
Head sampling vs tail sampling: decide before or after the trace
Head sampling decides at the start of a trace, usually in the SDK: a fixed percentage of traces is recorded and the rest are never created. It is cheap — no state, no memory, no gateway — and blind: it keeps 5 percent of errors and 5 percent of healthy traffic alike, so the trace that explains an outage is usually the one never recorded. Tail sampling decides after the trace completes, on the full trace: keep every error, keep slow traces, keep a thin slice of the healthy remainder. It is the right model for debugging, with two costs the head model lacks: statefulness and a gateway.
The tail sampling processor's documentation states the constraint plainly: all spans for a given trace must be received by the same collector instance for effective sampling decisions, and the processor keeps spans in memory while it waits to decide. Its policies, as documented, are latency (sample traces slower than a threshold in milliseconds), probabilistic (sample a percentage, hashing the trace ID), rate limiting (a token bucket in spans per second), bytes limiting (a token bucket in bytes per second), and composite policies that combine them. The decision_wait defaults to 30 seconds: the processor holds a trace up to 30 seconds waiting for its spans. That hold is a memory budget you must fund.
Deployment: agent, gateway, or both
The three tools deploy differently, and the deployment is the architecture. The Collector runs as an agent alongside each service, typically as a sidecar or DaemonSet, or as a gateway — a small fleet behind a load balancer that receives from all agents, applies tail sampling and filtering, and exports to the backend. Most estates run both. The Datadog Agent runs only as an agent. Alloy runs as an agent or a gateway like the Collector, with clustering to spread the load automatically.
Three failure modes decide the deployment. First, memory: a Collector without a memory limiter will grow until the host kills it, and the host is usually running your services too — set the limiter from the documented example (4,000 MiB limit, 500 MiB spike) and tune from observed peaks. Second, backpressure: when the backend is slow, the sending queue fills and exports block or drop; the batch processor, queue settings, and retries stand between a slow backend and lost telemetry. Third, the single point of decision: a tail-sampling gateway is stateful, so it needs trace-ID routing and enough instances.
Who this is for — and who must stay away
This playbook is for the operator choosing a telemetry pipeline for a production estate: the platform engineer who owns the Collector fleet, the founder pricing Datadog against Grafana Cloud, and the team whose trace bill just doubled.
It is not for a single-service hobby project, where the Collector's own documentation recommends direct OTLP export. It is not for a team already standardised on Datadog that uses its APM, RUM, and Watchdog features as one product — the Agent's lock-in is the price of that integration.
Founder & CEO Insight — Enow A. Jovial
Run the pipeline desk: execution checklist
- Measure first. Count spans per month, gigabytes per day, and active series.
- Put a Collector or Alloy gateway in front of any paid backend. Batching, filtering, and sampling belong before the meter.
- Set the memory limiter on every Collector (4,000 MiB limit, 500 MiB spike in the documented example).
- Choose the sampling model deliberately. Head sampling in the SDK for cost; tail sampling on a gateway for debugging.
- Route tail sampling by trace ID. All spans of a trace must reach the same gateway instance.
- Price the Datadog bill from the allowance. Twenty hosts include 3,000 GB of ingested spans.
- Read Grafana's log and trace rates from its calculator on the day you buy.
- Keep the exit. Export in OTLP so the backend is a configuration choice.
The decision in advance
The pipeline decision is a meter decision and an exit decision at once. The Collector preserves the exit and charges nothing per host; the Datadog Agent bundles the pipeline with the backend and prices the bundle per host; Alloy keeps the Collector's exit and adds Grafana's clustering and Prometheus pipelines. Price your volume first, then choose the sampling model.