The bill that arrives after the incident
A team of five engineers runs 20 hosts and ships 100 gigabytes of logs a month. The outage is over, the post-mortem is written, and then the observability invoice arrives: one vendor wants 1,100 dollars a month for the same telemetry, another wants 160 dollars, and a third wants 245 dollars. The difference is the meter: Datadog bills per host, then per gigabyte, then per million events. Grafana Cloud bills per thousand metric series and per gigabyte written. New Relic bills per user and per gigabyte ingested, with the first 100 gigabytes free.
> [!KEY TAKEAWAY]
> Observability pricing is a metering decision before it is a product decision. Datadog charges for the infrastructure you run, Grafana Cloud charges for the telemetry you emit, and New Relic charges for the people who look at it. The vendor cheapest at 100 gigabytes is not the vendor cheapest at 500, and the crossover is arithmetic, not opinion.
Who this guide is for, and who should stop here
This guide is for a founder, CTO, or lead engineer choosing a hosted observability platform for a United States software team of roughly 3 to 25 people, running roughly 10 to 100 hosts, and emitting roughly 50 to 500 gigabytes of logs a month. The worked example uses a reference workload of 20 hosts, 100 gigabytes of logs a month, 25,000 active metric series, and 5 users.
It is not for a team that has already standardised on a single vendor's agent and has no appetite to re-instrument: the migration cost dwarfs any monthly saving in this guide, and the right answer for that team is to negotiate the current contract, not to re-platform. It is also not for a regulated workload that requires a specific region, FedRAMP authorisation, or a data-residency guarantee: New Relic charges an additional 0.05 dollars per gigabyte per month for EU data-centre storage, and regional and compliance pricing is quote-only at all three vendors. If your logs contain cardholder data, health data, or credentials, fix the pipeline first: no observability vendor will redact your secrets for you.
> [!FOUNDER]
> "Every observability bill I have ever seen was a surprise exactly once, and then it was a budget line. The surprise is never the total. It is discovering which meter you actually agreed to. Count your hosts, count your gigabytes, count your series, and then read the price list. The vendor that wins is the one whose meter matches your shape, not the one whose demo was prettiest."
> — Enow A. Jovial, Founder & Chief Executive Officer
Three meters, not three prices
| Vendor | Infrastructure meter | Logs meter | Users meter |
| :--- | :--- | :--- | :--- | :--- |
| Datadog | 15 dollars per host per month, Infrastructure Pro, annual | 0.10 dollars per GB ingested, plus 1.70 dollars per million events indexed, 15-day retention | No per-user charge on infrastructure plans |
| Grafana Cloud | No per-host charge | 0.05 dollars per GB processed plus 0.40 dollars per GB written, 30-day retention | 8 dollars per active user beyond 3 free |
| New Relic | No per-host charge | 0.40 dollars per GB ingested beyond 100 GB free per month | Core users from 49 dollars per user; full platform Standard 10 dollars first user, 99 dollars per additional user |
A sourcing note, stated plainly. Datadog's pricing page is a client-rendered application that returns no price figures to a plain fetch from this network, so its figures here are corroborated across five independent reads of the vendor's own pricing page dated August to October 2026, and they agree to the dollar. Grafana Cloud's figures are read from Grafana's own pricing page and New Relic's from New Relic's own pricing page. Re-check every figure against the vendor page before you budget: a list price is a snapshot, not a contract.
The reference workload: 20 hosts, 100 gigabytes, 25,000 series, 5 users
Datadog first. Infrastructure Pro on 20 hosts is 300 dollars a month. APM on all 20 hosts is 620 dollars a month. Log ingestion on 100 gigabytes is 10 dollars. Indexing 100 million events, at 1 kilobyte per event, is 170 dollars at 15-day retention and 250 dollars at 30-day retention. With APM on every host, the monthly total is:
$
\text{Datadog} = 300 + 620 + 10 + 170 = 1,100
$
That is 1,100 dollars a month at 15-day indexing, or 1,180 dollars at 30-day indexing. The APM line is bigger than the infrastructure line, and the indexing line is bigger than the ingestion line by a factor of seventeen.
Grafana Cloud next. The platform fee is 19 dollars a month, which includes 10,000 active series, 50 gigabytes of logs, 50 gigabytes of traces, and 3 users. Metrics beyond the included 10,000 series are 15,000 billable series at 6.50 dollars per 1,000, which is 97.50 dollars. Logs beyond the included 50 gigabytes are 50 billable gigabytes at 0.55 dollars, the sum of 0.05 processed and 0.40 written plus 0.10 retention, which is 27.50 dollars. Users beyond the included 3 are 2 at 8 dollars, which is 16 dollars. The total is:
$
\text{Grafana Cloud} = 19 + 97.50 + 27.50 + 16 = 160.00
$
That 160 dollar total is independently corroborated: a separate October 2026 read of the same price list prices the identical 5-user, 25,000-series, 100-gigabyte workload at 160.00 dollars a month, line for line. Grafana Cloud's bill is dominated by metric series, not by logs: 97.50 dollars of series against 27.50 dollars of logs. Label design is the cost control: every high-cardinality label you add is a series, and every series is 0.0065 dollars a month, forever.
New Relic last. Data ingest is 100 gigabytes, which is inside the free 100 gigabytes a month, so the data line is zero. Five core users at 49 dollars each is 245 dollars a month. Five full platform users on Standard is 10 dollars for the first user plus 99 dollars for each additional user, which is 406 dollars a month. The total is:
$
\text{New Relic} = 0 + 245 = 245
$
on core users, or 406 dollars on Standard full platform users. Add five more engineers and the core-user line doubles to 490 dollars while the Grafana and Datadog bills barely move.
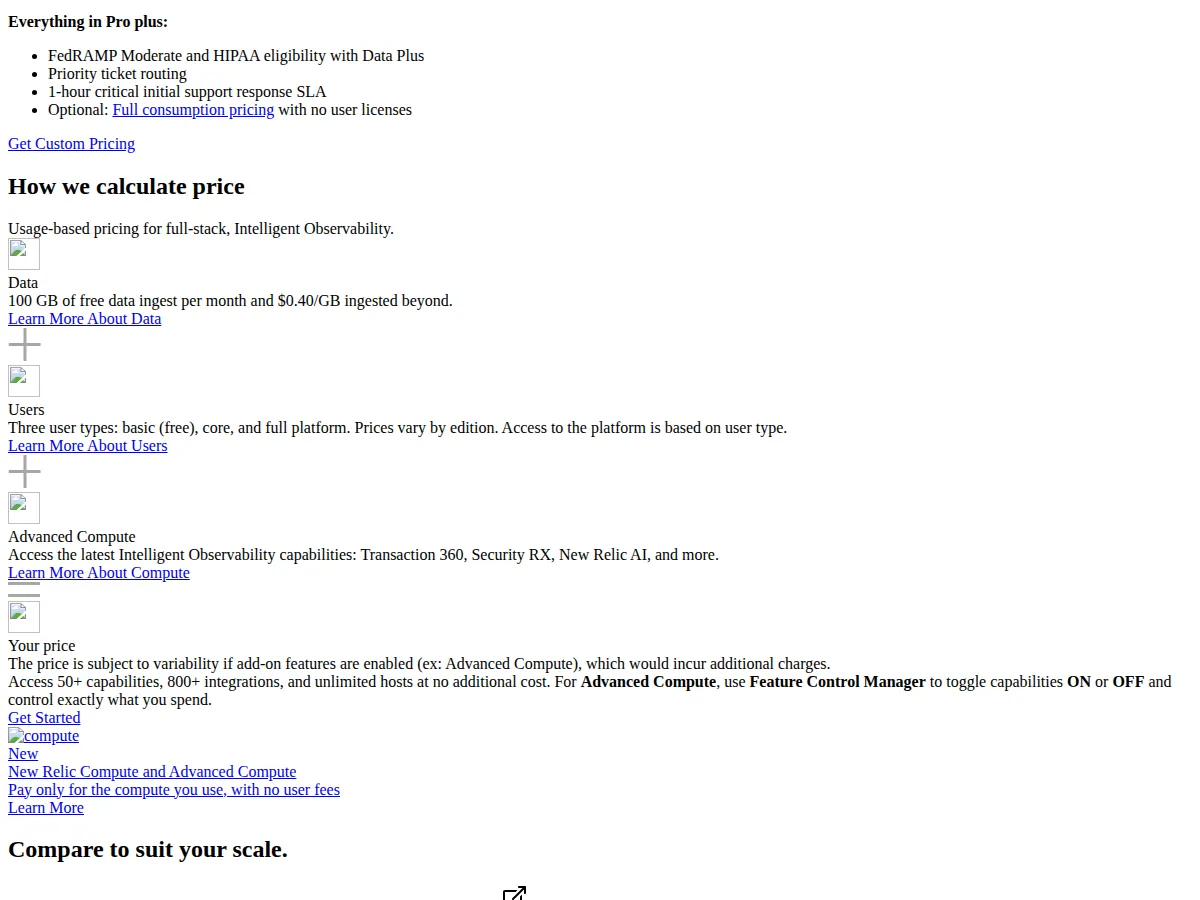
| Vendor | Monthly total, reference workload | Annual total | Largest line |
| :--- | :--- | :--- | :--- |
| Datadog, with APM on all hosts | 1,100 dollars | 13,200 dollars | APM, 620 dollars |
| Datadog, infrastructure and logs only | 480 dollars | 5,760 dollars | Infrastructure |
| Grafana Cloud Pro | 160 dollars | 1,920 dollars | Metrics, 97.50 dollars |
| New Relic, core users | 245 dollars | 2,940 dollars | Users, 245 dollars |
| New Relic, Standard full platform | 406 dollars | 4,872 dollars | Users, 406 dollars |
The hosting bill is the smaller line on the same stack: the Vercel versus Netlify versus Cloudflare Pages hosting playbook prices the frontend, the Cloudflare versus Fastly versus AWS CloudFront CDN playbook prices the delivery, and the CDN caching and stale-while-revalidate architecture guide prices the cache behaviour that decides how much of that delivery you actually pay for. Observability is the line that grows with your traffic, not with your pages. Model the whole stack through the website cost calculator before you commit to any of the three.
The log trap: ingestion is cheap, indexing is the bill
Datadog's log pricing has two meters, and the second one is the trap. Ingestion is 0.10 dollars per gigabyte. Indexing, which makes logs searchable in the main interface, is 1.70 dollars per million events at 15-day retention on annual terms, 2.55 dollars on demand, and 2.50 dollars at 30-day retention. At 1 kilobyte per event, 100 gigabytes is 100 million events, so the indexing line is 170 dollars against a 10 dollar ingestion line. Index 10 percent of events and the indexing line falls to 17 dollars, but the other 90 percent is not searchable unless you archive it or move it to Flex Logs. The same point holds at 300 gigabytes: 780 dollars a month with annual billing and 30-day indexing on every event, 1,155 dollars on demand, and 105 dollars if you index only 10 percent.
Scale the reference workload to 500 gigabytes of logs a month and the meters diverge completely. Datadog ingests 500 gigabytes for 50 dollars and indexes 500 million events for 850 dollars at 15-day retention, so the log line alone is 900 dollars. Grafana Cloud writes 450 billable gigabytes at 0.55 dollars, which is 247.50 dollars. New Relic ingests 400 billable gigabytes beyond the free 100 at 0.40 dollars, which is 160 dollars. The per-gigabyte all-in cost at the reference workload tells the same story in one number:
$
\text{Datadog per GB} = \frac{10 + 170}{100} = 1.80
$
$
\text{Grafana Cloud per GB beyond free} = 0.55
$
$
\text{New Relic per GB beyond free} = 0.40
$
Datadog's per-gigabyte cost is more than three times Grafana Cloud's and more than four times New Relic's, because Datadog indexes by default and charges per event for the privilege. That is a product decision: every log searchable, immediately, at a price that scales with event count.
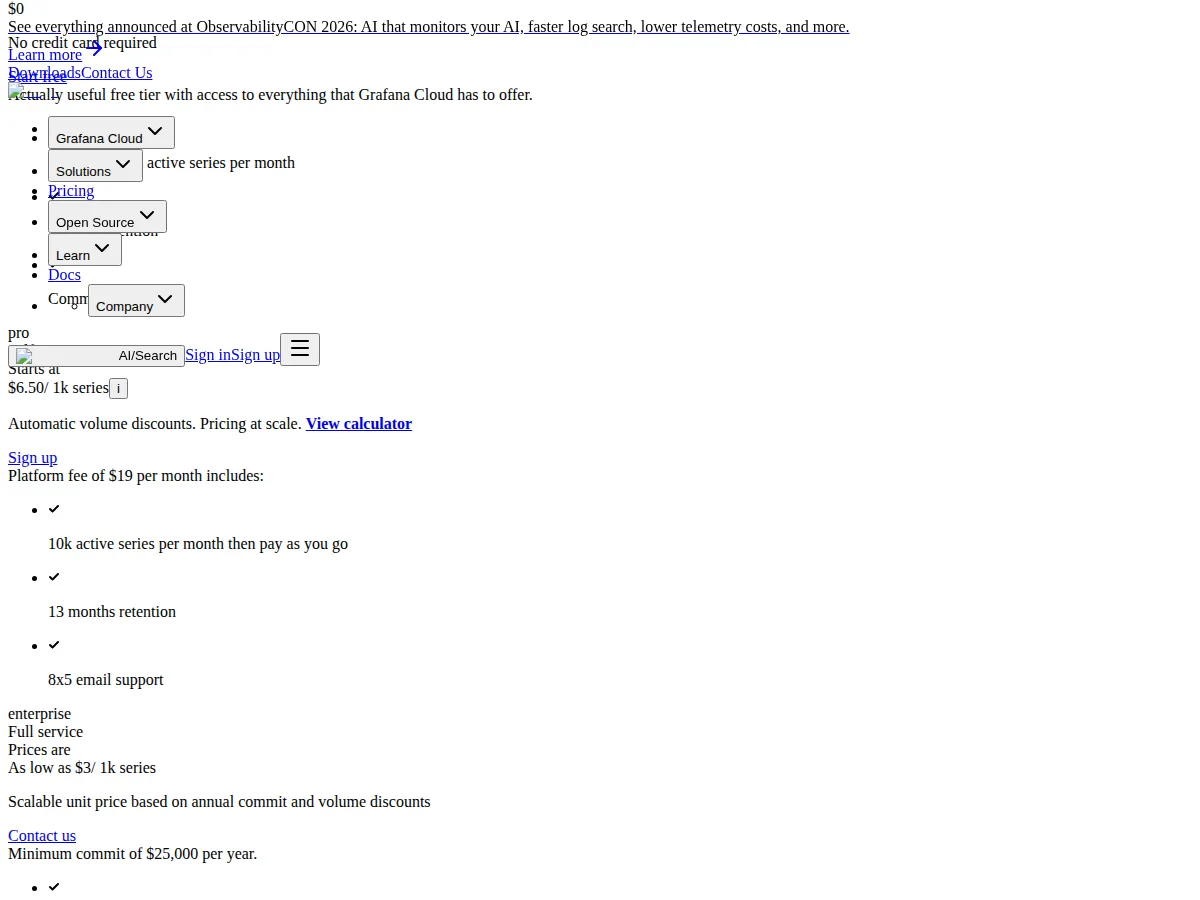
Retention is the second bill hiding inside the first. Datadog's 7-day indexing is 1.27 dollars per million events, 15-day is 1.70, and 30-day is 2.50, all on annual terms: doubling retention from 15 to 30 days raises the indexing line by 47 percent. Grafana Cloud charges 0.10 dollars per gigabyte for each extra 30-day retention increment, and its metrics retention is 13 months on Pro against 14 days on the free tier. New Relic's Data Plus option is 0.60 dollars per gigabyte against 0.40 for the original data option, and it buys extended retention and advanced data capabilities.
The decision table: which meter matches your shape
| Workload shape | Cheapest vendor | Why | Authority |
| :--- | :--- | :--- | :--- |
| Few hosts, heavy logs, small team | New Relic | 100 GB free ingest; data at 0.40 dollars per GB; users are the only other line | New Relic pricing page |
| Many series, moderate logs, small team | Grafana Cloud | No per-host charge; 160 dollars at the reference workload; free tier covers 10,000 series | Grafana Cloud pricing page |
| All logs searchable, incidents daily | Datadog | Indexing is the product; 1.70 dollars per million events buys instant search on every event | Datadog pricing, 5 corroborating reads |
| Large team, 20-plus viewers | Grafana Cloud | Users beyond 3 are 8 dollars each; New Relic core users are 49 dollars each | Grafana and New Relic pricing pages |
| High-cardinality metrics | New Relic | No per-series meter; metric volume rides inside the per-GB data price | New Relic pricing page |
The crossover points are the decision. New Relic is cheapest while data stays under roughly 100 gigabytes and the team stays small. Grafana Cloud is cheapest once metric series pass 10,000 and logs stay under a few hundred gigabytes, because its meters are the gentlest per unit. Datadog is cheapest never on list price at these volumes, and that is the honest statement: you buy Datadog for the integrated product and the indexed search, and you pay the premium knowingly, or you do not buy it at all.
> [!WARNING]
> Datadog bills host count at the high-water mark: the monthly rate is set by the peak host count in the period, not the average. An autoscaling event that spins up 40 extra hosts for six hours can set the whole month's host line. Grafana Cloud bills metric series the same way, on active series in the period, so a cardinality explosion from a bad label ships a bill that arrives a month later. Put a billing alert on both meters on day one, before the first deploy.
Operator boundaries: who should not use each vendor
Do not use Datadog without naming an indexing policy before the first log ships. Without exclusion filters, without a retention decision, and without a Flex Logs tier for cold data, the default is to index everything at 30 days, the most expensive configuration the product offers. Grafana Cloud should not be used by a team that will not govern label cardinality: a single label with a user ID or a request ID in it creates a new series per value, and 25,000 series becomes 250,000 series in one deploy. New Relic should not be used by a team that gives every engineer a full platform user by default: the Standard full platform price is 99 dollars per additional user, and five viewers who only read dashboards should be basic or core users, not full platform users.
Self-hosting is the fourth option and the honest one for the right team. Prometheus, Loki, and Tempo with Grafana OSS cost nothing in licences and everything in operations: storage, retention, upgrades, and the on-call rotation for the monitoring system itself. A team with a dedicated platform engineer and a predictable workload can beat all three hosted bills.
> [!TIP]
> Before you sign, run one week of real telemetry through each vendor's free tier and read the actual bill.