A graph database comparison that only compares query languages is a toy. The three serious managed graph databases — Neo4j AuraDB, Amazon Neptune, and TigerGraph Savanna — do not even price the same thing. Neo4j sells RAM by the GB-hour and bills storage at the same rate once you pass a free quota. Neptune sells an instance by the hour and bills storage and I/O separately, so a storage-heavy graph stays cheap. TigerGraph sells capacity by the GB per month, with an instance-hour price list sitting on the same page that prices the same workload three times higher. Pick the query language first and you will pick the wrong database; price the workload first and the language decision usually makes itself.
Founder & CEO Insight — Enow A. Jovial
The three pricing models, side by side
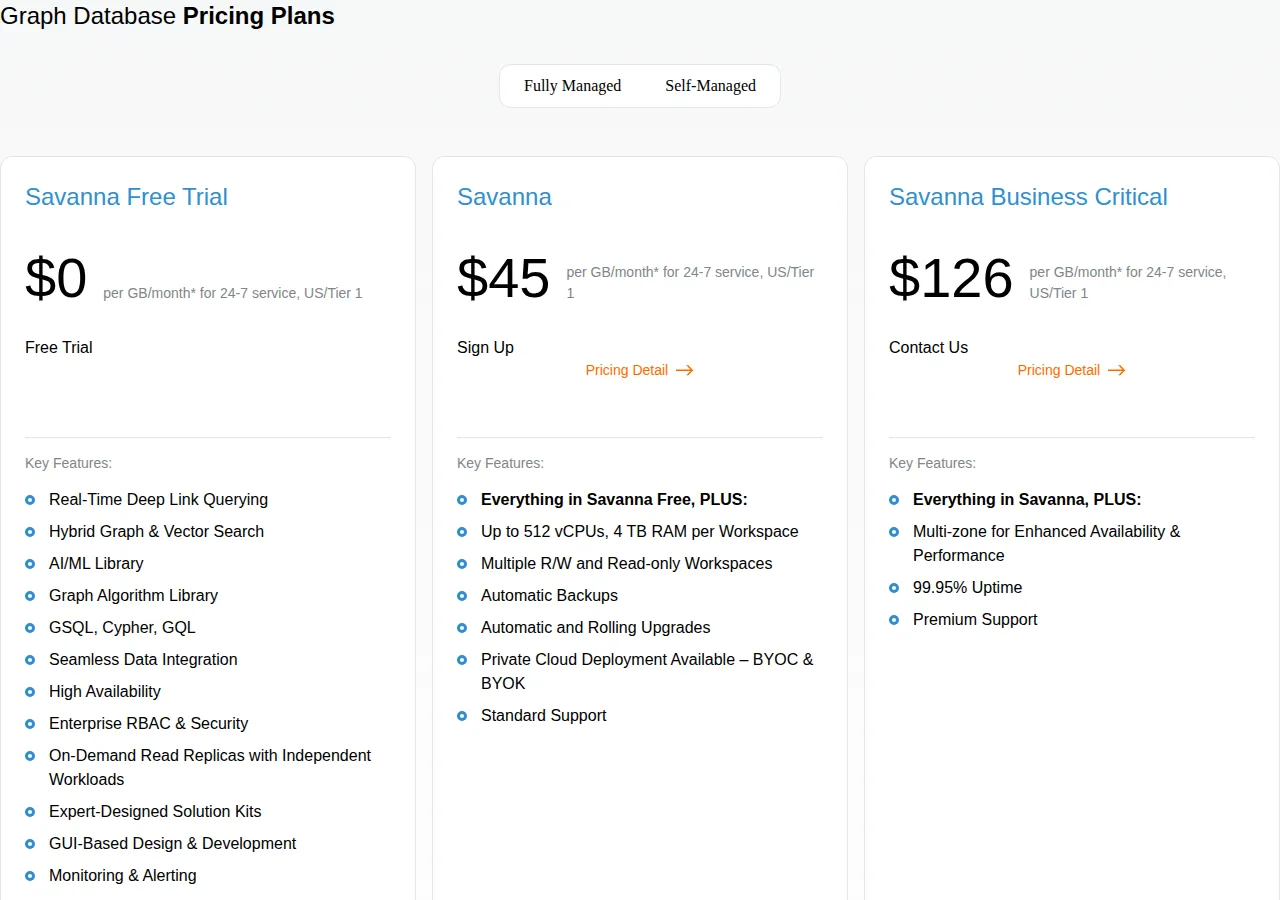
| Neo4j AuraDB | Amazon Neptune | TigerGraph Savanna | |
|---|---|---|---|
| Unit sold | GB-hours of RAM | Instance-hours + GB-months + I/Os | GB of graph per month (or instance-hours) |
| Entry paid tier | Professional, from $0.09/GB/hour, 1 GB minimum | db.r5.large on-demand, $0.348/hour | Savanna, $45/GB/month |
| Free tier | $0: 200,000 nodes, 400,000 relationships, 1 GB storage | 750 hours db.t3.medium/t4g.medium, 10M I/O, 1 GB storage, 30 days | $0/GB/month trial, 32 vCPUs, 256 GB RAM per workspace |
| Storage | Free quota of 2× RAM; extra billed in GB-hours at the compute rate | $0.10/GB-month (Standard); $0.225/GB-month (I/O-Optimized) | $0.025/GB-month, fully elastic |
| I/O | Included — no separate I/O charge | $0.20 per million requests (Standard); $0 (I/O-Optimized) | Included |
| High-availability tier | Business Critical, from $0.20/GB/hour, 2 GB minimum, 99.95% SLA | I/O-Optimized configuration, no I/O charges | Business Critical, $126/GB/month, 99.95% uptime |
| Query languages | Cypher | Gremlin, openCypher, SPARQL | GSQL, Cypher, GQL |
| Data models | Property graph only | Property graph + RDF | Property graph (+ vector search) |
| Authority | neo4j.com/pricing; Neo4j Aura quotas docs | aws.amazon.com/neptune/pricing | tigergraph.com/pricing |
The model matters more than the rate. Neptune is the only one of the three that runs both a property graph and RDF (SPARQL) in the same engine, so a team that needs both does not need two databases. Neo4j is the only one with a genuinely free tier that runs a real, if small, graph — 200,000 nodes and 400,000 relationships with no credit card. TigerGraph is the only one whose headline price is a flat per-GB monthly figure, which makes it the easiest to budget and the hardest to compare, because a GB of graph is not a GB of RAM.
Worked example: a 10 GB graph serving a read-heavy API
Take a fraud-detection graph: 10 million nodes, 50 million relationships, 10 GB of data, served by a read-heavy API doing about 50 million I/O requests a month. Price it on all three at 730 hours a month.
Neo4j AuraDB Professional, 4 GB instance. Compute is 4 GB × $0.09 × 730 hours. Storage is the trap: the free quota is twice the RAM, 8 GB, so 2 GB of the 10 GB graph bills as extra storage at the same $0.09 per GB-hour.
Amazon Neptune, db.r5.large on-demand. The instance is $0.348 an hour, storage is $0.10 per GB-month, I/O is $0.20 per million requests.
AWS publishes its own arithmetic for a larger version of the same shape — a db.r5.large with 50 GB of storage, 100 GB of backup, and 200 million I/Os — at $296.61 for a 720-hour month: $250.56 instance, $5.00 storage, $1.05 backup, $40.00 I/O. The vendor's own example confirms the structure: the instance dominates, storage and I/O are rounding.
TigerGraph Savanna, per-GB plan. Ten GB at $45 per GB-month, plus storage at $0.025 per GB-month.
At 10 GB the ranking is Neptune $265.04, Neo4j $394.20, TigerGraph $450.25. Neo4j is already 49 percent more expensive than Neptune on the same graph, and the entire gap is the storage surcharge — the compute alone, $262.80, is cheaper than Neptune's instance. That is the pricing model doing its work: Neo4j's headline rate looks like the cheapest of the three until the storage line appears.
Worked example: the same graph at 100 GB
Scale the graph tenfold — 100 GB of data, same 50 million I/Os a month — and the ranking inverts into a rout.
Neo4j, 16 GB instance. Compute is 16 × $0.09 × 730. The free storage quota is 32 GB, so 68 GB bills as extra storage at $0.09 per GB-hour.
Storage is now 81 percent of the bill. The RAM you bought is not the cost; the data you stored is.
Neptune, same db.r5.large. Instance $254.04, storage 100 × $0.10 = $10.00, I/O 50 × $0.20 = $10.00, backup about $1.05.
TigerGraph Savanna, per-GB plan. One hundred GB at $45 per GB-month plus storage.
At 100 GB, Neptune costs $275.09 a month while Neo4j costs $5,518.80 and TigerGraph $4,502.50 — Neptune is twenty times cheaper than Neo4j on the same data. The difference is not performance or features. It is that Neptune's storage costs $0.10 per GB-month while Neo4j's storage, past the free quota, costs $0.09 per GB-hour — $65.70 per GB-month, 657 times more. Any graph whose data is large relative to its working set should be priced on Neptune first, and any Neo4j deployment should be sized so the graph fits inside twice the RAM.
The high-availability tier, priced
The entry tiers above are all single-zone. Production means the HA tier, and the HA math is where the three diverge again.
- Neo4j Business Critical starts at $0.20 per GB-hour with a 2 GB minimum, so the floor is 2 × $0.20 × 730 = $292.00 a month before a single query runs. It buys multi-zone deployment, a 99.95 percent uptime SLA, 30-day backup retention with hourly point-in-time restore, read-only secondaries, and CDC.
- TigerGraph Business Critical is $126 per GB-month. The same 10 GB graph costs 10 × $126 + $0.25 = $1,260.25 a month, with multi-zone deployment, a 99.95 percent uptime, and premium support. The instance-table route is worse: the smallest Business Critical instance, TG-00, is $2.80 an hour with 3× replication — $2,044.00 a month.
- Neptune I/O-Optimized removes the I/O charge entirely. AWS's own example — a db.r5.large I/O-Optimized with 50 GB of storage and 450 million I/Os — totals $350.56: $338.26 instance, $11.25 storage, $1.05 backup, $0 I/O. AWS states the rule directly: if I/O exceeds 25 percent of total Neptune spend, I/O-Optimized can save up to 40 percent on I/O-intensive workloads. At 450 million I/Os, the Standard configuration would have charged $90.00 for I/O alone.
The query-language decision, in one paragraph
If the team already writes Cypher, Neo4j is the path of least resistance and TigerGraph is the second choice — TigerGraph supports Cypher alongside its native GSQL and the newer GQL standard, so existing Cypher queries port with the least rewriting. If the workload is RDF, SPARQL, or a knowledge graph that must answer both property-graph and RDF queries, Neptune is the only option of the three; neither Neo4j nor TigerGraph runs SPARQL. If the workload is deep-link analytics — multi-hop traversals, community detection, PageRank over billions of edges — TigerGraph's GSQL and its parallel engine are built for exactly that, and its instance table tops out at 512 vCPUs and 4 TB of RAM per workspace. The vector-database comparison in the Qdrant vs Pinecone vs pgvector architecture guide covers the adjacent decision: all three graph vendors now bolt vector search onto the graph, but none of them is a vector database first.
The decision framework
- Choose Neptune when the graph is large relative to its working set, when storage dominates the bill, when you need both property graph and RDF, or when you already run inside AWS and the instance can sit in the same AZ as the application (data transfer between Neptune and EC2 in the same AZ is free).
- Choose Neo4j when the graph fits inside twice the RAM of a small instance, when the team writes Cypher, when the free tier's 200,000 nodes and 400,000 relationships are enough to learn on, or when the ecosystem — Bloom, the algorithm library, the driver maturity — matters more than the storage line.
- Choose TigerGraph when the workload is deep-link analytics at scale, when a flat per-GB monthly figure is worth a premium for budgeting, or when GSQL's parallel traversal is the feature the query needs.
- Choose none of them when the graph is really a relational workload with a few joins: a 10 GB graph on Neptune at $265.04 a month is still far more than the same data costs to hold in the ClickHouse vs Snowflake vs BigQuery warehouse comparison, and a warehouse answers the aggregation queries a graph database answers slowly.
Execution checklist: price your graph before you migrate
- [x] Step 1 — Measure the graph: count nodes, relationships, and total GB on disk. The pricing unit is the graph size, not the query count.
- [x] Step 2 — Size the Neo4j instance so the graph fits inside twice the RAM: the free storage quota is 2× RAM, and every GB past it bills at $0.09 per GB-hour — $65.70 per GB-month.
- [x] Step 3 — Price Neptune with the vendor's own example: a db.r5.large with 50 GB and 200 million I/Os is $296.61 on the pricing page. Replace its numbers with yours and the total follows.
- [x] Step 4 — Ask TigerGraph which price surface applies: the $45 per GB-month plan and the instance table price the same workload $450.25 against $1,460.00. Get it in writing.
- [x] Step 5 — Check the I/O ratio on Neptune: if I/O is more than 25 percent of the bill, price the I/O-Optimized configuration — AWS states it saves up to 40 percent on I/O-intensive workloads.
- [x] Step 6 — Confirm the HA floor: Neo4j Business Critical starts at $292.00 a month, TigerGraph Business Critical at $126 per GB-month. Budget the HA tier, not the entry tier.
- [x] Step 7 — Test the free tier first: Neo4j AuraDB Free runs 200,000 nodes and 400,000 relationships with no credit card; Neptune's free trial is 750 hours for 30 days. Load a slice of the real graph before committing.
- [x] Step 8 — Run the break-even: put the three monthly totals into the break-even calculator and find the graph size where Neptune's flat storage beats Neo4j's per-GB-hour storage — on the worked numbers it is below 10 GB.
- [x] Step 9 — Price the lakehouse alternative: if the workload is analytics, not traversal, compare against the Snowflake vs Databricks pricing playbook before buying a graph database at all.
- [x] Step 10 — Re-price every quarter: Neo4j's per-GB-hour rates, Neptune's instance prices, and TigerGraph's per-GB rates all move. A graph that was cheapest on Neptune at 10 GB may not be cheapest at 100 GB — the worked examples above prove it.
Who should not buy a managed graph database
This playbook is for teams with a real graph workload: fraud rings, recommendation traversals, knowledge graphs, or identity resolution across millions of connected records. It does not apply to a team whose "graph" is three tables with foreign keys — a relational database answers those queries faster and cheaper, and the graph database is the wrong tool at any price. It does not apply to a workload that is really analytics: if the queries are aggregations over the whole dataset rather than traversals from a starting node, the warehouse comparison is the right starting point. And it does not apply to a team that has not measured its graph: without node counts, relationship counts, and GB on disk, every number in this playbook is a guess. Measure first, then price. One failure mode this playbook does not soften: all three managed services lock you in by dialect — Cypher, Gremlin, and GSQL are not portable, so a migration after a year of queries is a rewrite, not a rehost. One failure mode this playbook does not soften: all three managed services lock you in by dialect — Cypher, Gremlin, and GSQL are not portable, so a migration after a year of queries is a rewrite, not a rehost.