A company buys business intelligence the way it buys office space: by looking at the brochure and signing for the room it will need in three years. The bill arrives per user, per month, and the number that matters is not the headline price — it is the price multiplied by every person who will ever open a dashboard. Looker, Tableau and Power BI are the three platforms a serious buyer compares, and they price the same seat in three different ways: Looker does not publish a per-user price at all, Tableau sells editions that start at $15 a user a month, and Power BI sells a $14 Pro seat and a $24 Premium Per User seat. The comparison below uses only the prices on the vendors' own pricing pages, accessed November 20, 2026, and it says so wherever a price does not exist.
The three platforms, and what each one actually sells
Looker (Google Cloud core) sells a semantic layer. The product is LookML: a governed data model that every dashboard, report and AI query draws from, so a metric defined once means the same thing in every department. The platform comes in three editions — Standard, Enterprise and Embed — and every edition includes one production instance, 10 Standard Users and 2 Developer Users. User licenses come in three types: Developer Users build LookML models and use the API, Standard Users create dashboards and explore data, Viewer Users view and filter. The platform pricing for all three editions is "call sales" on an annual commitment, with one-, two- and three-year terms.
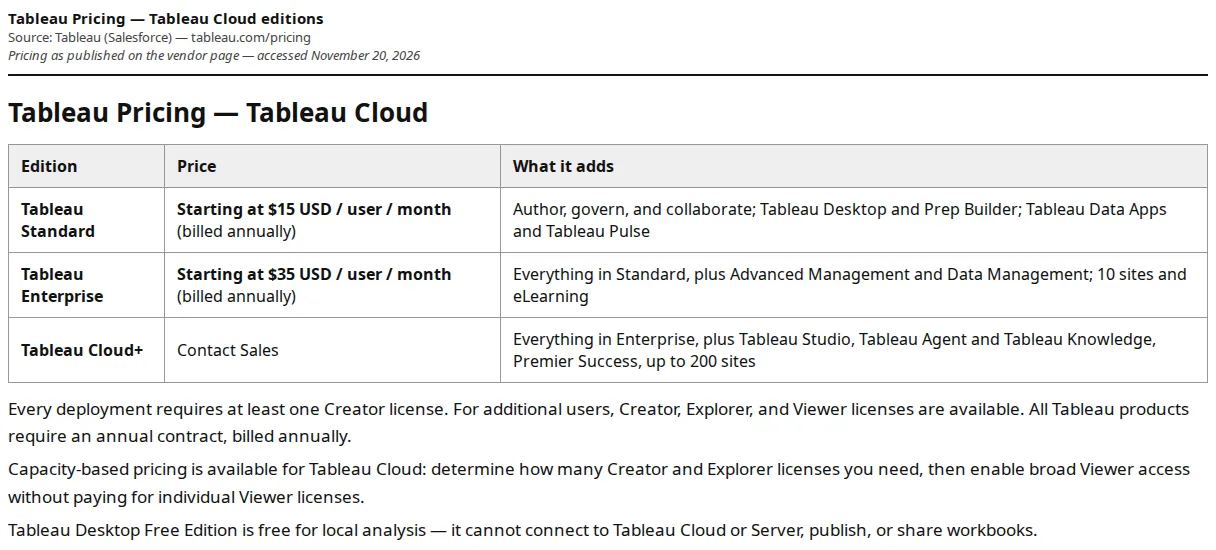
Tableau Cloud sells visual analytics. The product is the workbook: drag-and-drop exploration, governed data sources, and Tableau Pulse and Tableau Agent for AI-written metric explanations. Tableau Cloud comes in Standard at $15 per user per month, Enterprise at $35, and Cloud+ on a sales quote, all billed annually on an annual contract. License types are Creator, Explorer and Viewer, and every deployment requires at least one Creator license. Tableau Desktop Free Edition costs nothing, but it cannot connect to Tableau Cloud or Server, publish work, or share packaged workbooks — it is a single-player tool.
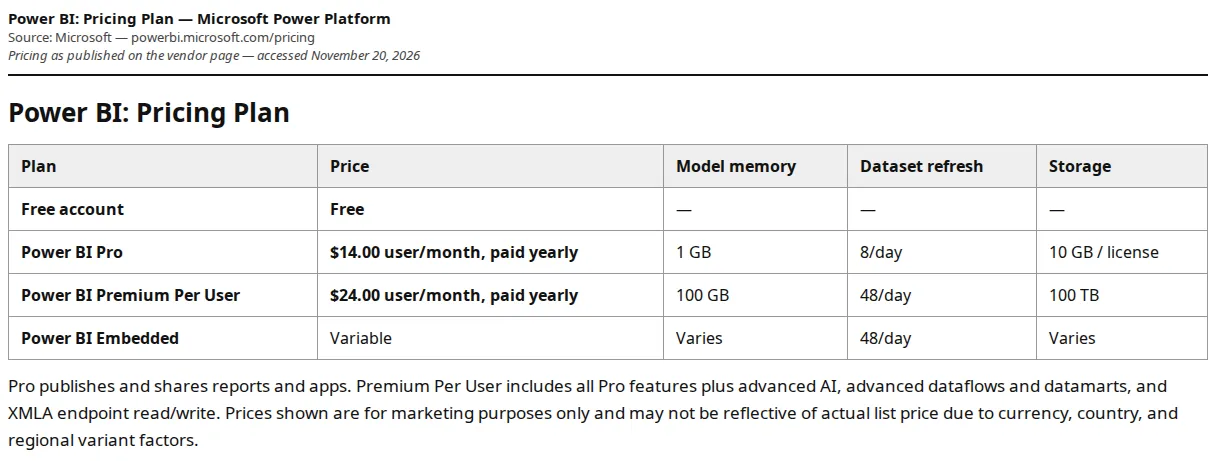
Power BI sells the Microsoft stack. The product is the report: Power BI Desktop for authoring, the Power BI service for sharing, and Fabric for the data underneath. The plans are Free at $0, Pro at $14 per user per month paid yearly, Premium Per User at $24 per user per month paid yearly, and Embedded at a variable price for customer-facing analytics. The ceiling that separates Pro from Premium Per User is concrete: Pro caps a dataset at 1 GB of model memory, 8 refreshes a day and 10 GB of storage per license; Premium Per User raises those to 100 GB, 48 refreshes a day and 100 TB, and adds advanced AI, advanced dataflows and datamarts, and XMLA endpoint read and write.
| Capability | Looker (Google Cloud core) | Tableau Cloud | Power BI |
|---|---|---|---|
| Entry paid price | Quote only — no published per-user price | Standard from $15/user/mo, billed annually | Pro $14/user/mo, paid yearly |
| High tier | Enterprise and Embed — quote only | Enterprise from $35/user/mo; Cloud+ quote | Premium Per User $24/user/mo |
| Free tier | None published | Desktop Free Edition — local only, no publishing | Free — authoring only, no sharing |
| Authoring users | Developer / Standard | Creator | Pro / Premium Per User (Desktop free) |
| View-only users | Viewer User | Viewer | Pro / Premium Per User for shared content |
| Model / memory ceiling | LookML semantic model; API caps by edition | Capacity-based Viewer blocks available | Pro 1 GB model, 8 refreshes/day; PPU 100 GB, 48/day |
| AI layer | Conversational Analytics, token-metered | Tableau Agent, Tableau Pulse, Tableau Knowledge | Copilot in Fabric; advanced AI on PPU |
| Contract | Annual commitment, 1/2/3-year terms | Annual contract, billed annually | Paid yearly on Pro and PPU |
| Authority | cloud.google.com/looker/pricing | tableau.com/pricing | powerbi.microsoft.com/pricing |
The monthly math at 10, 50 and 200 users
The only reproducible comparison is the one built from published prices, so Looker stays out of the table below until a quote arrives — pricing a quoted product with an invented number would be fabrication, and this guide does not do it. Tableau and Power BI publish per-user prices, so their math is exact.
| Users | Tableau Standard ($15) | Power BI Pro ($14) | Tableau Enterprise ($35) | Power BI Premium Per User ($24) |
|---|---|---|---|---|
| 10 | $150/mo — $1,800/yr | $140/mo — $1,680/yr | $350/mo — $4,200/yr | $240/mo — $2,880/yr |
| 50 | $750/mo — $9,000/yr | $700/mo — $8,400/yr | $1,750/mo — $21,000/yr | $1,200/mo — $14,400/yr |
| 200 | $3,000/mo — $36,000/yr | $2,800/mo — $33,600/yr | $7,000/mo — $84,000/yr | $4,800/mo — $57,600/yr |
Two gaps carry the decision. On the low tier, Pro undercuts Standard by $1 a user a month — $120 a year at 10 users, $2,400 a year at 200. On the high tier, Premium Per User undercuts Enterprise by $11 a user a month — $1,320 a year at 10 users, $26,400 a year at 200. But the tiers are not the same product: Enterprise buys Advanced Management, Data Management, 10 sites and eLearning; Premium Per User buys the 100 GB model, 48 refreshes a day and the XMLA endpoint. A buyer who pays the Tableau premium and never uses Advanced Management has bought governance it does not need; a buyer who picks Pro to save $1 a seat and then hits the 1 GB model cap has bought a ceiling it will pay to remove.
The ceilings that decide the tier
Price tables hide the ceilings, and the ceilings decide the tier. Power BI's are the most explicit on the page: a Pro dataset stops at 1 GB of model memory, so a model that grows past a gigabyte forces either a Premium Per User upgrade at $24 a seat or a move to Fabric capacity. The refresh limit is the same shape: 8 dataset refreshes a day on Pro against 48 on Premium Per User, so a team that refreshes hourly hits the Pro ceiling at the ninth refresh. Storage follows the same split — 10 GB per Pro license against 100 TB on Premium Per User.
Tableau's ceiling is the viewer count. Tableau Cloud sells capacity-based pricing for exactly this problem: buy the Creator and Explorer licenses the team needs, then enable broad Viewer access through capacity-based Viewer Blocks with no overage charges, instead of paying per Viewer. The price of a block is a sales conversation, not a published number, so the honest way to model it is to price the named-user path first — every user at the edition rate — and treat the capacity quote as the discount to negotiate, not the price to budget.
Looker's ceilings are API calls and AI tokens. A Standard edition instance allows 1,000 query-based API calls and 1,000 administrative API calls a month; Enterprise raises those to 100,000 and 10,000; Embed to 500,000 and 100,000. Conversational Analytics is metered in data tokens: each named user adds 1,000,000 input tokens and 20,000 output tokens a month to a shared instance pool, with a 60,000,000 input-token floor on production instances. Access is promotional — no billing for usage within fair-use limits — through January 31, 2027, and from February 1, 2027 overage bills at $3.00 per million input tokens and $20.00 per million output tokens. A team that adopts the AI layer in 2026 is budgeting a metered cost that starts in 2027, and the quote it signs now should name that price in writing.
Who should not buy each one
Do not buy Looker if the buying team cannot get a written quote before the decision date. A quoted platform with no published floor cannot be compared on price, and a team that assumes Looker costs "about the same as Tableau" has assumed the one number the vendor never published. Do not buy Tableau Standard if the whole company needs to view dashboards: the per-user edition price charges the same $15 for a viewer as for an author, and the capacity-based Viewer Blocks exist precisely because that math punishes broad readership. Do not buy Power BI Pro if the data model is already near a gigabyte or the business refreshes more than eight times a day — the upgrade to Premium Per User is $10 a seat a month, and the migration of a live model between tiers is the expensive part, not the license.
The lock-in shapes differ, too. Looker locks in through LookML: the semantic model is the asset, and it does not export to Tableau or Power BI. Tableau locks in through workbooks and the annual contract — every product requires an annual contract, billed annually, so the exit date is the renewal date. Power BI locks in through Fabric: the reports are cheap, the data gravity is in the lakehouse, and the $14 seat is the on-ramp to a capacity bill. None of these is a reason not to buy; each is a reason to price the second year before signing the first.
The 30-day selection sequence
- Count the seats by role, not by headcount. List creators, explorers and viewers separately — the three vendors charge the same seat differently, and the viewer count decides whether Tableau's capacity blocks or Power BI's per-user model wins.
- Measure the model before pricing it. Record the largest dataset's size, the refreshes per day, and the storage the team needs; a 1 GB Pro cap or a 1,000-call Looker API cap is a fact, not a preference.
- Get the three quotes in writing. Tableau's edition prices are published; Looker's platform price and Tableau's capacity Viewer Blocks are not. A comparison without the Looker quote is a comparison of two products.
- Run the 10/50/200 math on the quotes, not the brochure. Recompute the tables above with the quoted numbers, and price the second year — renewal, viewer growth, and Looker's February 2027 token billing.
- Pilot one real dashboard on each finalist. Build the same report, with the same data, on two platforms, and time the build and the first refresh; the pilot is the only test of the authoring experience.
- Sign the annual contract only after the exit is priced. Confirm the renewal price, the data-export path for LookML models and Tableau workbooks, and the Fabric capacity the Power BI reports will need.
- [x] Seats counted by role: creators, explorers and viewers listed separately.
- [x] Ceilings measured: largest model size, refreshes per day, storage, API calls.
- [x] Looker quote obtained in writing: platform price, edition, and token overage rates named.
- [x] Capacity Viewer Blocks priced: Tableau's named-user total compared against the block quote.
- [x] Second-year cost modeled: renewal price, viewer growth, February 2027 token billing.
- [x] Pilot built on two finalists: same report, same data, build time and first refresh timed.
Founder & CEO Insight — Enow A. Jovial
Related reading on this site: the Google Analytics 4 vs Mixpanel vs Amplitude guide for the product-analytics sibling of this decision, and the ClickHouse vs Snowflake vs BigQuery guide for the warehouse underneath the BI layer. Before signing, run the per-user totals through the break-even calculator at the seat counts the team will actually reach in year two, not the seat count it has today.