Landing Page Conversion Rate Optimization Playbook
Landing Page Conversion Rate Optimization Playbook
A paid click lands on a page, and the auction is over — a different contest begins. The ad platforms price the click — the google-ads-vs-meta-ads-small-business-roas-playbook and the tiktok-ads-vs-meta-ads-ecommerce-roas-playbook work those auctions — but what happens after the click is decided by the landing page: how fast it loads, how little it asks, and whether the offer matches the promise that earned the click. CRO is the disciplined improvement of that page, one measured change at a time. This playbook runs it on a stated site: 10,000 visitors a month, a 2 percent baseline conversion rate, and an $85 average order value. All three are stated assumptions for the worked example, not figures from any source.
Step 1: What the page is actually for
A landing page has one job: carry a visitor from the click to one action. Every element that does not serve that action is a cost — a competing second headline, a navigation bar that offers an exit, a form field that asks for information the business does not need yet. The benchmark that frames the work comes from Unbounce's 2024 Conversion Benchmarks report: across all industries, the median landing-page conversion rate is 6.6 percent, measured across more than 41,000 landing pages, 464 million visitors, and 57 million conversions in the year studied. A page converting at 2 percent sits well below the median, and the gap is the size of the opportunity.
Step 2: The speed budget — LCP, INP, CLS
Speed is the first conversion lever: it acts before the visitor reads a word. Google's web.dev guidance sets the Core Web Vitals thresholds that define a good experience: Largest Contentful Paint, the loading measure, within 2.5 seconds of when the page first starts loading; Interaction to Next Paint, the interactivity measure, at 200 milliseconds or less; and Cumulative Layout Shift, the visual-stability measure, at 0.1 or less.
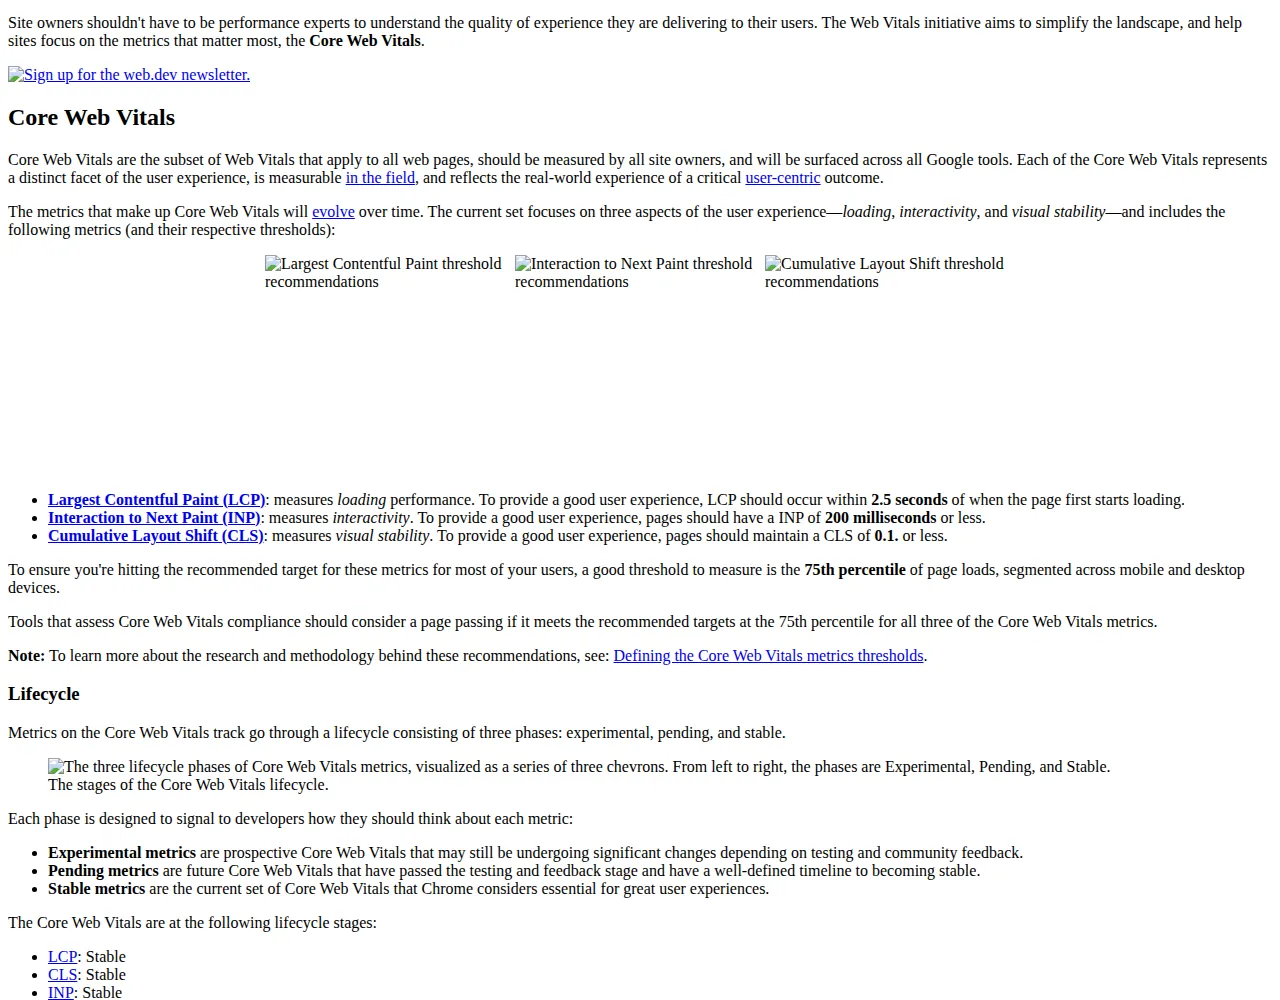
The budget becomes an operating rule: no page ships with an LCP above 2.5 seconds on a mid-range phone, no control takes more than 200 milliseconds to respond, and nothing moves after first render. The usual offenders are uncompressed hero images, third-party scripts loaded before the content, and chat widgets that arrive with the page. Remove what the page does not need before optimizing what remains, and measure on the device visitors use — usually a phone.
Step 3: Form friction — what the visitor is asked to give up
Once the page loads, the next leak is the form. Baymard Institute's research puts the scale of the problem in plain numbers: the average cart abandonment rate across 50 studies is 70.22 percent, with the studies ranging from 55 to 84 percent. Baymard estimates 35.26 percent of that abandonment is recoverable through better checkout design — about $260 billion in recoverable orders across the US and EU. The same research counts the average checkout at 11.3 form fields, and finds that 22 percent of users have abandoned a purchase because the checkout was too long or too complicated.
The rule: ask for the least information that completes the transaction, and ask for the rest later. A lead form that needs a name and an email should not also demand a phone number, a company size, and a budget range on first contact. Each field is a small tax on the visitor's patience, and the tax compounds — the fields that look harmless in isolation are the ones that push the 22 percent out. Practical cuts: delete optional fields rather than marking them optional, use a single full-name field instead of first-plus-last, and put the trust signals — guarantee, refund terms, contact route — beside the submit button. A checkout that needs a shipping address should not also demand account creation before payment; guest checkout is a conversion feature, not a security risk.
Step 4: The math — sizing a test that can actually detect the lift
This is where most small-business testing fails, quietly. A test run on too few visitors cannot distinguish a real lift from noise, and the operator who ships the "winner" anyway is shipping a coin flip. The sample size for a two-proportion A/B test at a chosen significance level and power comes from Evan Miller's published sample-size formula, which his calculator implements:
Here $p$ is the baseline conversion rate and $\delta$ is the absolute minimum detectable effect. The formula gives the number of visitors needed per variation.
The worked example, on the stated assumptions: baseline conversion rate $p = 0.02$, a 20 percent relative lift, so the treatment rate is $p + \delta = 0.024$ and $\delta = 0.004$. Significance level 5 percent, so $Z_{\alpha/2} = 1.96$; power 80 percent, so $Z_{\beta} = 0.8416$:
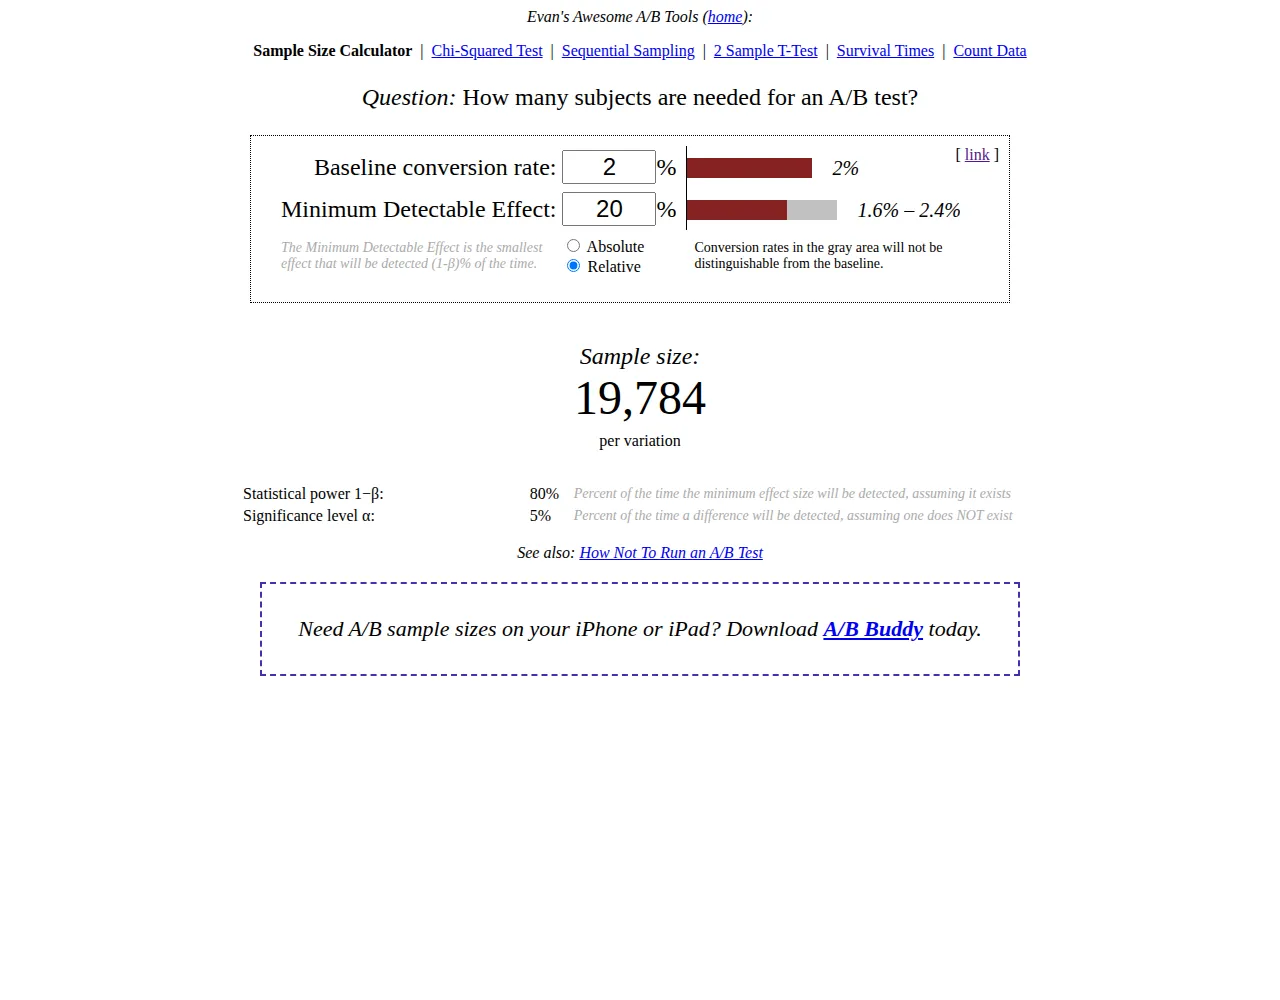
Nineteen thousand seven hundred eighty-four visitors per variation means 39,568 visitors in total for a two-variant test. At 10,000 visitors a month, the test takes 3.96 months — about 120 days — to reach its planned sample. That duration is the honest price of detecting a 20 percent lift at a 2 percent baseline. For contrast: a 50 percent relative lift (2 percent to 3 percent) needs only 3,292 visitors per variation, 6,584 in total, or about 20 days at the same traffic; a 10 percent relative lift (2 percent to 2.2 percent) needs 78,039 per variation, 156,078 in total, or about 15.6 months. Small effects are expensive to prove. Test big changes — a rewritten offer, a halved form, a different price anchor — and leave the button-colour tests to sites with ten times the traffic.
The revenue side closes the loop. If the 20 percent lift is real and ships, the site gains 40 conversions a month:
Step 5: Choose the platform — the decision table
A landing-page platform is bought for three things: building without a developer, testing without extra tooling, and surviving the traffic the ads send. Prices below were read from each vendor's own pricing page on 2026-11-12. Unbounce's tiers are quoted on annual billing, with the monthly-billing price in parentheses; Leadpages' tiers are quoted on annual billing, 20 percent below monthly billing.
| Option | What it costs | What it does | Authority |
|---|---|---|---|
| Unbounce Build | $74/mo ($99 monthly) | Unlimited pages, 20,000 visitors a month, no A/B testing | Unbounce pricing page |
| Unbounce Experiment | $112/mo ($149 monthly) | Unlimited A/B testing and pages, 30,000 visitors a month | Unbounce pricing page |
| Unbounce Optimize | $187/mo ($249 monthly) | AI traffic routing, 50,000 visitors a month | Unbounce pricing page |
| Leadpages Grow | $99/mo | Unlimited pages, A/B testing, no traffic cap | Leadpages pricing page |
| Leadpages Pro | $29/mo | Publish pages, no A/B testing | Leadpages pricing page |
| Your own site + a calculator | $0 platform cost | Build in your existing CMS; size tests with the Step 4 formula | Evan Miller sample-size calculator |
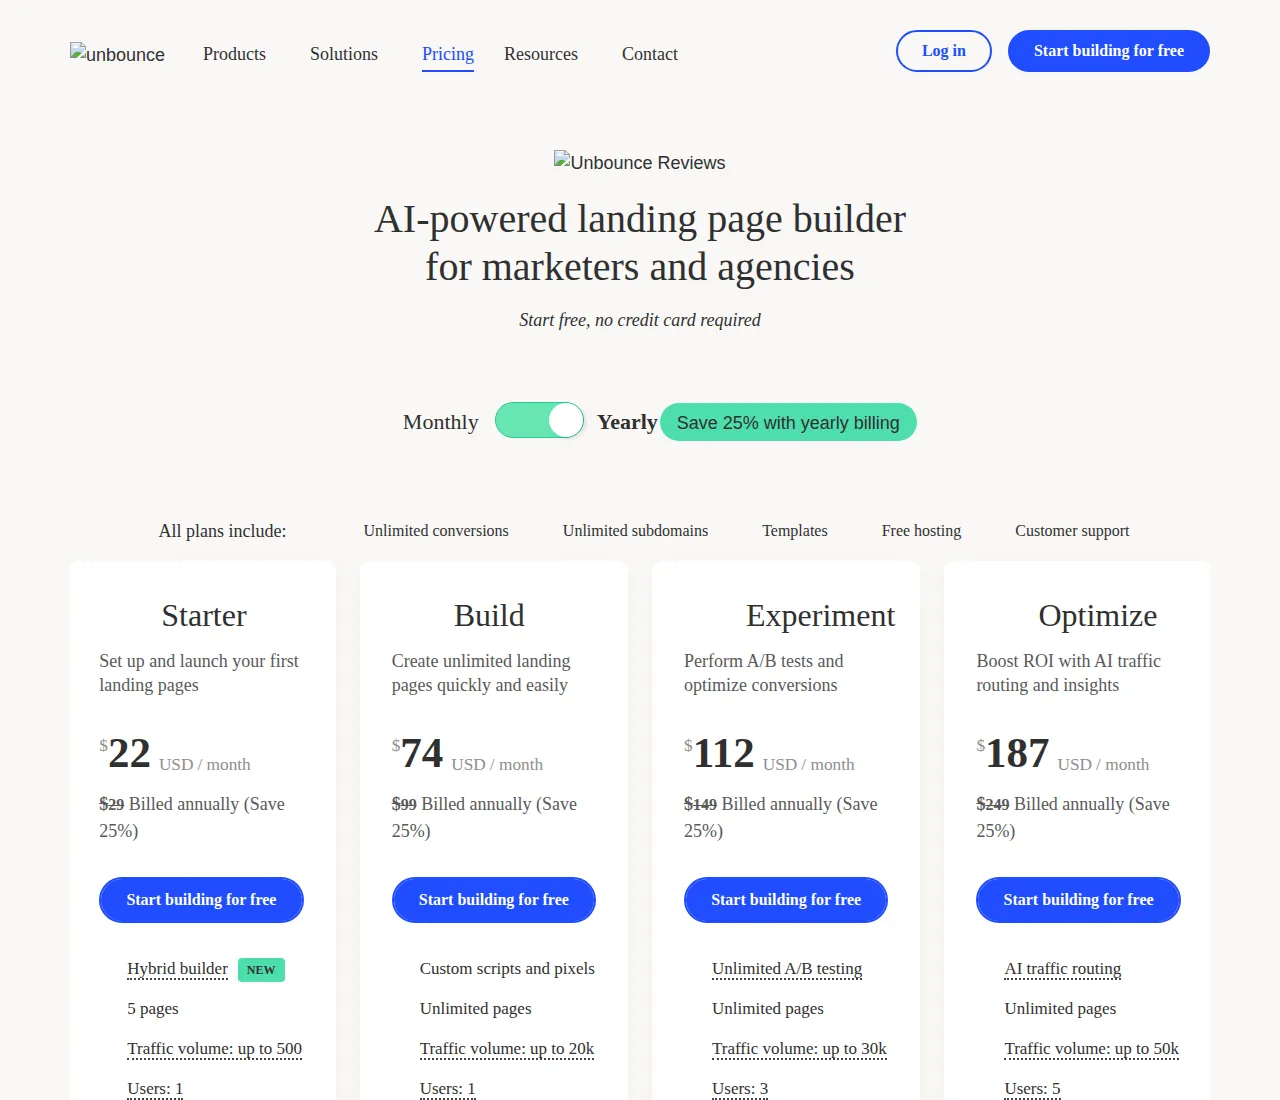
Read the table against the traffic the site actually gets. The stated site at 10,000 visitors a month fits inside Unbounce Build's 20,000-visitor cap, but Build has no A/B testing — the operator who buys Build to run tests has bought the wrong tier, and the testing tier is Experiment at $112 a month on annual billing. Leadpages Grow at $99 a month includes A/B testing with no traffic cap, which makes it the cheaper testing tier for a site whose traffic may grow past 20,000 visitors. The no-platform row is honest for a site that already has a CMS: the formula in Step 4 is free, and the calculator that implements it is free.
Step 6: How tests fail — the failure-mode layer
A test can be run correctly and still mislead — these five failure modes each produce a confident wrong answer.
Peeking. Checking daily and stopping the moment the treatment pulls ahead inflates the false-positive rate far above the stated 5 percent. The sample size in Step 4 is a commitment: the test is read once, when the planned sample is reached.
Underpowered tests. A test that needs 39,568 visitors, called after two weeks on a site that gets 10,000 a month, is the same error in a different shape. A flat result says nothing and a positive result is likely luck.
Novelty effects. A changed page often wins in its first week because it is new, not better, and the lift fades as visitors get used to it. Run the test across at least two full weekly cycles so weekday and weekend traffic both appear in each variant.
Mismatch between ad and page. The linkedin-ads-vs-google-ads-b2b-lead-cost-playbook prices the B2B click, but if the ad promises a free audit and the page offers a demo, the visitor leaves, and no page test fixes a broken promise. Match the headline to the ad's promise word for word before testing anything else.
Testing without a baseline. A site that does not know its conversion rate cannot size a test — the formula needs the baseline $p$. Measure for a full month first.
Step 7: Where CRO sits in the funnel
CRO is the last mile of paid media, not a substitute for it: the auction articles establish what a click costs, and CRO establishes what it is worth once it arrives. A campaign with a strong ad and a weak page pays the auction price and wastes most of it — the 70.22 percent abandonment figure from Step 3 is that waste. The order of operations is fixed: first the offer and the audience, then the page, then the test. Run the ROI calculator on the funnel before buying more traffic: if the page converts at 2 percent and the click costs more than $1.70 at an $85 order value, the campaign loses money before CRO begins; the fix is the page, not the bid.
The build operation, start to finish
- [x] Measure the baseline conversion rate for a full month, on the visitors' device mix.
- [x] Set the speed budget: LCP within 2.5 seconds, INP 200 milliseconds or less, CLS 0.1 or less, at the 75th percentile.
- [x] Cut the form to the fields the transaction needs; move the rest to after the conversion.
- [x] Pick one hypothesis and one primary metric before the test starts.
- [x] Size the test with the formula in Step 4; write the sample size and the stop date down.
- [x] Run the test to the planned sample without peeking; read it once.
- [x] Ship the winner only if it clears the planned sample; otherwise keep the control and test a bigger change.
- [x] Record the result — hypothesis, sample, outcome, revenue effect — so the next test starts from evidence.
Founder & CEO Insight — Enow A. Jovial