Google Search Console (GSC) is the only tool in which Google tells you how your site appears in its search results. It is free, it needs a verified property, and it records your queries, clicks, indexing failures and experience scores. Every other SEO tool — including the paid suites in our Ahrefs vs Semrush vs Moz pricing playbook — estimates what GSC reports directly.
This playbook is a repeatable audit in four passes — Performance, Indexing, Core Web Vitals (CWV), and Manual Actions — ending with an export habit that protects you from GSC's one unforgiving limit: its 16-month memory. Work it quarterly, or monthly on a site you are actively growing.
Who this audit is for — and who should skip it
Run it if you operate a site with a few dozen indexed pages and can act on what it finds: change templates, rewrite pages, fix server errors, or commission the work. Skip it, or run only the Performance pass, if the site is under two weeks old, if you cannot change the site, or if you need competitor data — GSC shows only your own property, no sessions, conversions or on-site behaviour; pair it with GA4 for that.
Founder & CEO Insight — Enow A. Jovial
The audit in ten steps
- Verify the property and set the date range. Confirm owner-level access — a domain property covers all subdomains and protocols. Set Performance to the last 28 days for the working view and "Last 16 months" for the archive export.
- Export before you analyse. Download Performance data at query and page level for the full 16 months — GSC deletes history daily, so the export you skip this quarter is history you cannot recover.
- Triage Performance by segment. Filter by device (mobile first), then by query. Sort by impressions and read the top 50 — the queries Google already associates with your site.
- Isolate the striking-distance segment. Filter to queries at average position 4–10 — already on page one. Run the next section's math on this segment before touching anything else.
- Read the Page indexing report by reason. Work through "Why pages aren't indexed" in the decision-table order. A 5xx outranks a duplicate label every time: Google cannot judge a page it cannot fetch.
- Check Core Web Vitals by URL group. Mobile first. Fix every group labelled Poor before "Needs improvement" — the group status is set by its worst metric.
- Check Manual Actions and Security Issues. A green check costs thirty seconds.
- Inspect the sitemap state. Confirm the sitemap was read, the discovered-URL count is close to your real page count, and the file is not blocked by robots.txt.
- Spot-check five URLs with URL Inspection. Pick one URL per finding and run a live test.
- Write the fix list with owners and dates, then Validate fix. File one fix per URL group, and click Validate fix only after the whole group is fixed: one stray URL keeps the issue open for 28 days.
The math: turning impressions into a fix list
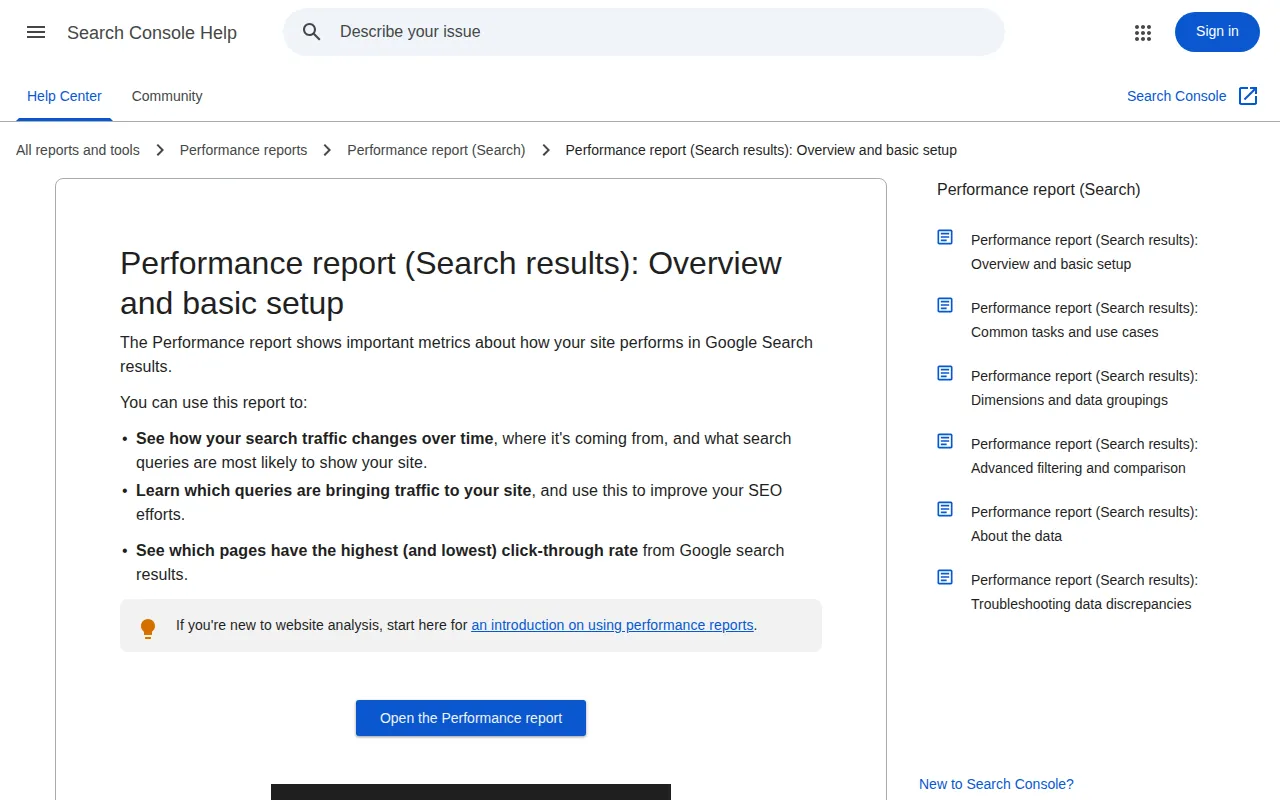
Each Performance row gives four numbers: clicks, impressions, average CTR, and average position. CTR is clicks divided by impressions.
The example below is an arithmetic model from those definitions — 28 days, 96,000 impressions, 2,880 clicks, position 14.6. Nothing in it is a Google benchmark; repeat the method on your own export.
The 6.0% figure is an assumed target, not a Google-published benchmark — there is no official CTR-by-position table. What the arithmetic proves is the payoff: the segment already earns 41,000 impressions at positions 4–10, so a two-point CTR improvement doubles its clicks without a single new ranking. Per page: 12,000 impressions at 1.8% CTR earn 216 clicks; at 4.5% CTR, 540 — a gain of 324 (+150%).
Two cautions. The table shows at most 1,000 rows, so the long tail is counted in the chart totals but hidden from the table — export the data or query the API for the full list. And average position is the topmost result from your site, not the page you are reading about. Filter by page first.
The decision table: every finding, its report, its fix
| Finding | GSC report | Fix | Authority |
|---|---|---|---|
| High impressions, position 4–10 | Performance (Queries) | Rewrite title and meta description for the intent | GSC Help: Performance report |
| Server error (5xx) | Page indexing | Fix the server fault, then request re-crawl | GSC Help: Page indexing report |
| URL blocked by robots.txt | Page indexing | Remove the blocking rule | GSC Help: Page indexing report |
| URL marked 'noindex' | Page indexing | Remove the noindex tag or header | GSC Help: Page indexing report |
| Soft 404 | Page indexing | Return a real 404 for dead pages | GSC Help: Page indexing report |
| Duplicate without user-selected canonical | Page indexing | Set one canonical URL per content set | GSC Help: Page indexing report |
| Crawled — currently not indexed | Page indexing | Improve the page or merge it | GSC Help: Page indexing report |
| CWV group labelled Poor | Core Web Vitals | Fix the worst metric in the group, then Validate fix | Google Search Central: Core Web Vitals |
| Sitemap over 50 MB or 50,000 URLs | Sitemaps | Split into sitemaps under one index | GSC Help: Sitemaps report |
| Manual action present | Manual actions | Fix every page, then file one reconsideration request | GSC Help: Manual actions report |
Core Web Vitals: Google's numbers, not vibes
Core Web Vitals (CWV) measure real-user experience in loading, interactivity, and visual stability. Google's thresholds are public and exact:
- Largest Contentful Paint (LCP) — loading. Good is under 2.5 seconds.
- Interaction to Next Paint (INP) — responsiveness. Good is under 200 milliseconds.
- Cumulative Layout Shift (CLS) — visual stability. Good is a score under 0.1.
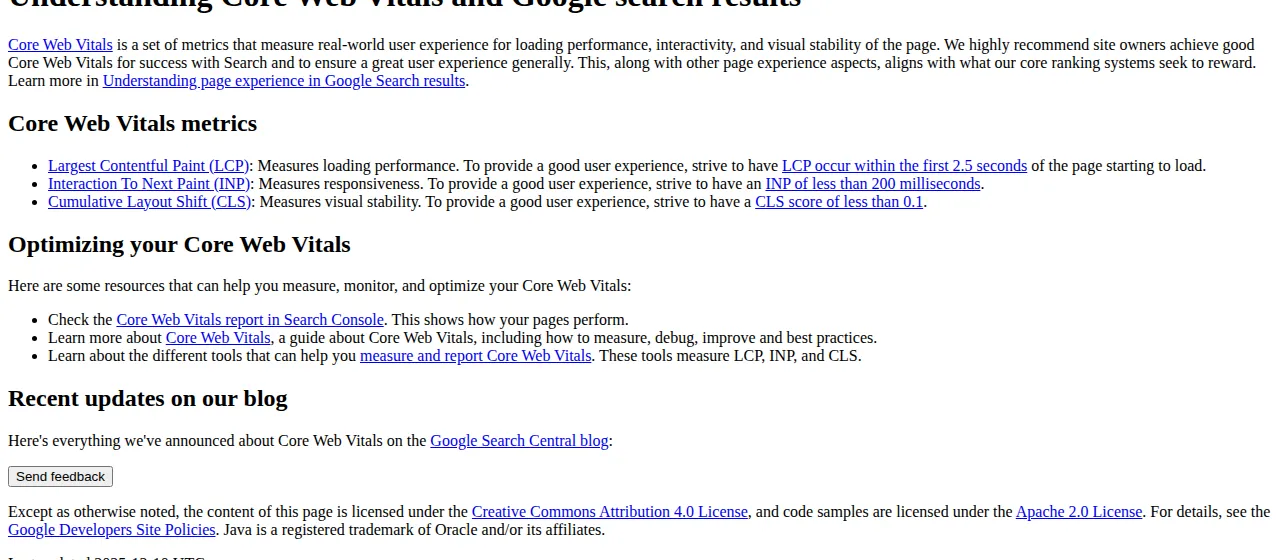
The CWV report groups URLs with a similar user experience and grades the group by its worst metric, using 28 days of CrUX field data. A group with poor CLS but good INP is Poor. Google's advice: fix everything labelled Poor first, then the issues affecting the most URLs.
Two mechanics matter. A URL group usually shares one cause — a template, a shared script, a font load — so fixing the template fixes the group. And Validate fix restarts a 28-day clock on CrUX data; the issue is fixed only if it appears in no URL during that window.
Indexing triage: read the reasons, not the counts
Headline counts mislead: a site with 400 "not indexed" URLs can be healthy if 380 are parameter pages and old redirects. The reasons are the audit:
- Server error (5xx): Fix the server, then request a re-crawl.
- Redirect error: Flatten it to a single 301.
- Blocked by robots.txt: a robots.txt block does not guarantee non-indexing — Google can index a URL from other information without loading it. To keep a page out, remove the block and use noindex instead.
- Marked 'noindex': If intentional, congratulations; if not, remove the tag or header and confirm with a live test.
- Soft 404: Return a real 404 for dead pages.
- Not found (404): A 404 is not a defect by itself — but a moved page needs a 301. The report only lists URLs that 404'd in the past month.
- Duplicate / alternate: Canonicalise, consolidate, or accept the exclusion.
URL Inspection is the only way to check one URL's index state. The live test has a blind spot: it does not test duplicate or canonical conditions.
Manual actions: the thirty-second check that overrides everything
A manual action is issued by a human reviewer at Google who has determined pages are not compliant with its spam policies. Affected pages are ranked lower or omitted from search results, with no visual indication to the user. If the report shows a green check, move on. If it shows an action, stop the audit: nothing else matters until this is resolved.
Fix every affected page and file a single reconsideration request describing the fixes. Fixing only some pages earns no partial return, and multiple actions must all be fixed. Reviews take time — do not resubmit before a final decision. If you recently bought the site, say so in the request.
Sitemaps: the discovery checklist
Submitting a sitemap means telling Google where the file is; you cannot upload one. A failed fetch gets retried for a few days before Google stops trying. The hard limits are 50,000 URLs per file, 50 MB uncompressed per file, and 50,000 sitemaps per index. A site with 120,000 URLs needs three files under one index:
Check three things: the sitemap was read, the discovered-URL count is close to your real page count, and the sitemap is not blocked by robots.txt. Discovery is not indexing, and no sitemap guarantees a crawl.
The export habit: beating the 16-month window
Search Console keeps performance data for the last 16 months, rolling forward daily — each morning, the oldest day falls off permanently. The default view shows only the past three months, and new data arrives 2–3 days late, marked preliminary on a dotted line. That combination quietly destroys year-over-year analysis for anyone who never exports.
Set up one of these before the next quarter:
- Monthly manual export. On the first working day of each month, export Performance at query and page level for the full 16 months. Sixteen files preserve a full year-over-year view.
- Daily bulk export to BigQuery. Google's scheduled export writes performance data to BigQuery daily and keeps it as long as you retain it. It has no backfill, so start it now, not when you first need the history.
Diagnostic data — URL Inspection, index reasons, security issues, manual actions — is not subject to the limit. Only the performance history expires.
Prioritisation: P0, P1, P2
P0 ships this week: any manual action, any 5xx on indexed URLs, a robots.txt rule blocking whole sections, any CWV Poor group on the homepage or top templates. P1 ships this month: striking-distance rewrites, soft 404s, noindex errors, sitemap repairs. P2 is the backlog: "Needs improvement" groups, canonical clean-up, parameter pages. Re-run after the P0 batch and let the numbers, not the calendar, reorder P1.
The identifiers paragraph
For the record, when you hand this audit to a developer: the property is verified at the DNS or HTML-file level; Googlebot honours robots.txt directives and noindex meta tags or X-Robots-Tag headers; the XML sitemap lives at /sitemap.xml and is referenced in robots.txt; CWV field data comes from CrUX while lab data comes from Lighthouse and PageSpeed Insights; the Search Analytics API returns the same data the UI shows; and GA4, not GSC, owns sessions, conversions and on-site behaviour. A fix is verified by the URL Inspection live test plus the 28-day Validate fix window — not a green check in a third-party crawler.
Where this fits
A GSC audit is the diagnostic pass; the fixes belong to the rest of your stack. Striking-distance rewrites pair with the demand map in our programmatic SEO guide for B2B SaaS; CWV template fixes land in the hosting and rendering layer, covered by our technical SEO guide on decoupled web apps and edge prerendering; local businesses should run the same Performance pass against their Google Business Profile playbook data; and if the fix list grows faster than your team can ship it, our frontend hosting pricing comparison covers where a faster deploy pipeline pays for itself.
Run the audit, export the data, fix the P0 list, and validate once. Next quarter the same ten steps take half the time.