CLV answers one question
Customer lifetime value answers a single question: how much gross profit will this customer produce before they leave? Pricing, sales hiring, ad budgets, and valuation all follow from that answer.
Two versions exist. Historical CLV records what a finished cohort already produced. Predictive CLV forecasts what a live cohort will produce. The first is accounting; the second is a model, and a model that hides its churn, margin, and discount rate is a guess with a spreadsheet around it.
> [!KEY TAKEAWAY]
> Historical CLV is a record. Predictive CLV is a forecast. The two are never interchangeable, and a predictive CLV that does not state its churn, margin, and discount rate in the open is not a number you can defend.
Historical CLV: what the cohort already did
Historical CLV is the simplest honest number in SaaS finance: take a cohort that has already churned out, add up the gross profit they produced, divide by the number of customers. No discount rate, no survival curve, no assumption. The result is exact — and useless for deciding what to spend on the next customer, because the next customer has not lived yet. Its value is as a check: if historical CLV says $2,100 and your model says $4,000, the model is wrong until proven otherwise.
David Skok's formula, published on For Entrepreneurs and still the industry base, is:
$
\text{LTV} = \text{ARPU} \times \text{Average Lifetime} - \text{Cost to Serve (COGS)}
$
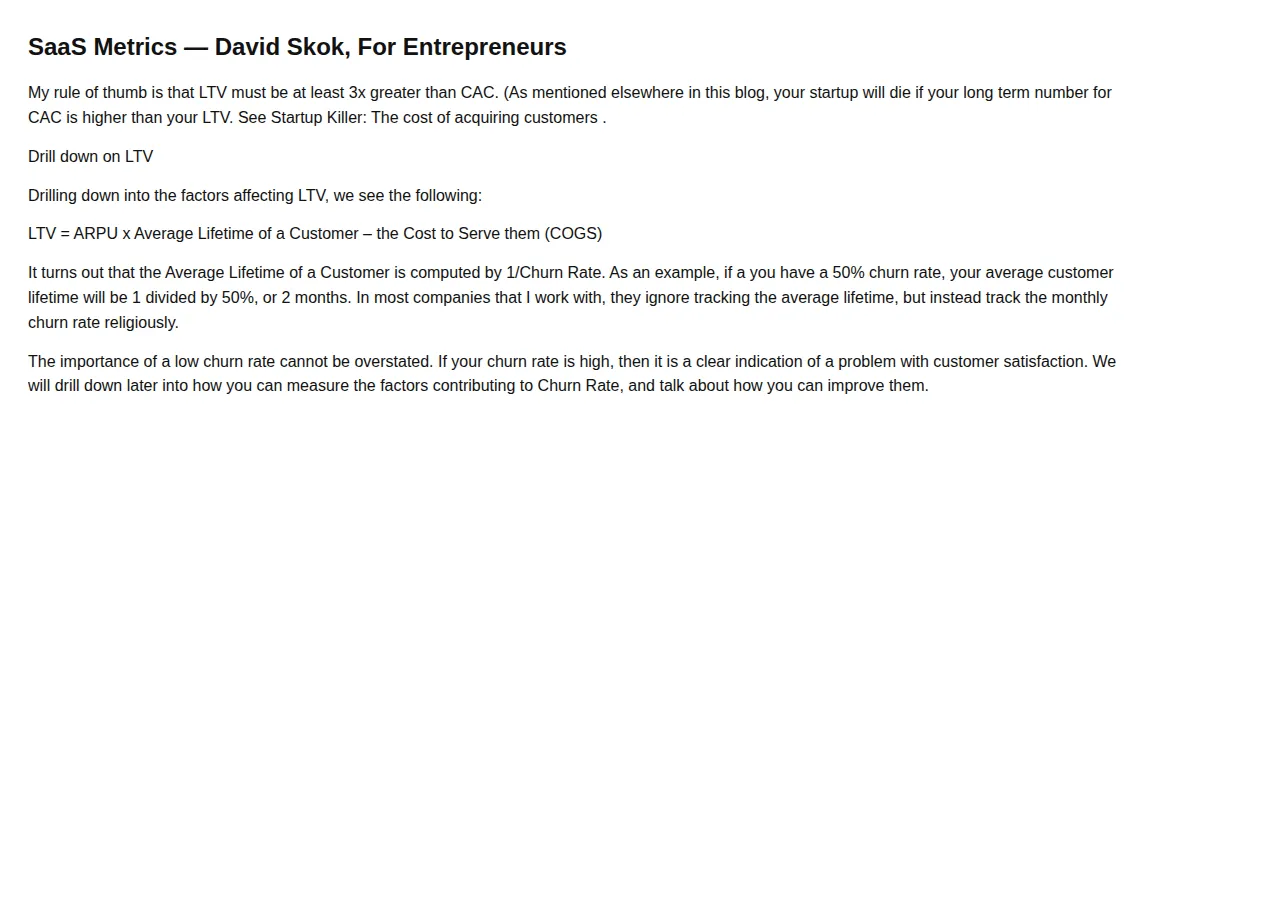
Skok states the average lifetime of a customer as 1 divided by the churn rate. His example: a 50 percent churn rate gives an average lifetime of 1 divided by 50 percent, or 2 months. One rule before the math: CLV is built on gross margin, not revenue — hosting, support, success, and payment processing come off first. Sales and marketing costs belong in CAC, not in the margin.
Predictive CLV: what the next cohort will do
Predictive CLV replaces the finished cohort with a survival curve: each month a share of the cohort remains and pays. The value is the sum of each month gross profit, discounted back to today. With a constant monthly churn rate, monthly gross profit, and monthly discount rate, the sum collapses to one line:
$
\text{Predictive CLV} = \frac{\text{ARPU} \times \text{Gross Margin}}{\text{Monthly Churn} + \text{Monthly Discount Rate}}
$
Set the discount rate to zero and the formula reduces to the historical form. A flat churn rate understates real cohorts — churn is highest in the first months and falls as the survivors settle in — so read a flat-rate model as a conservative floor.
The retention curve is the whole game
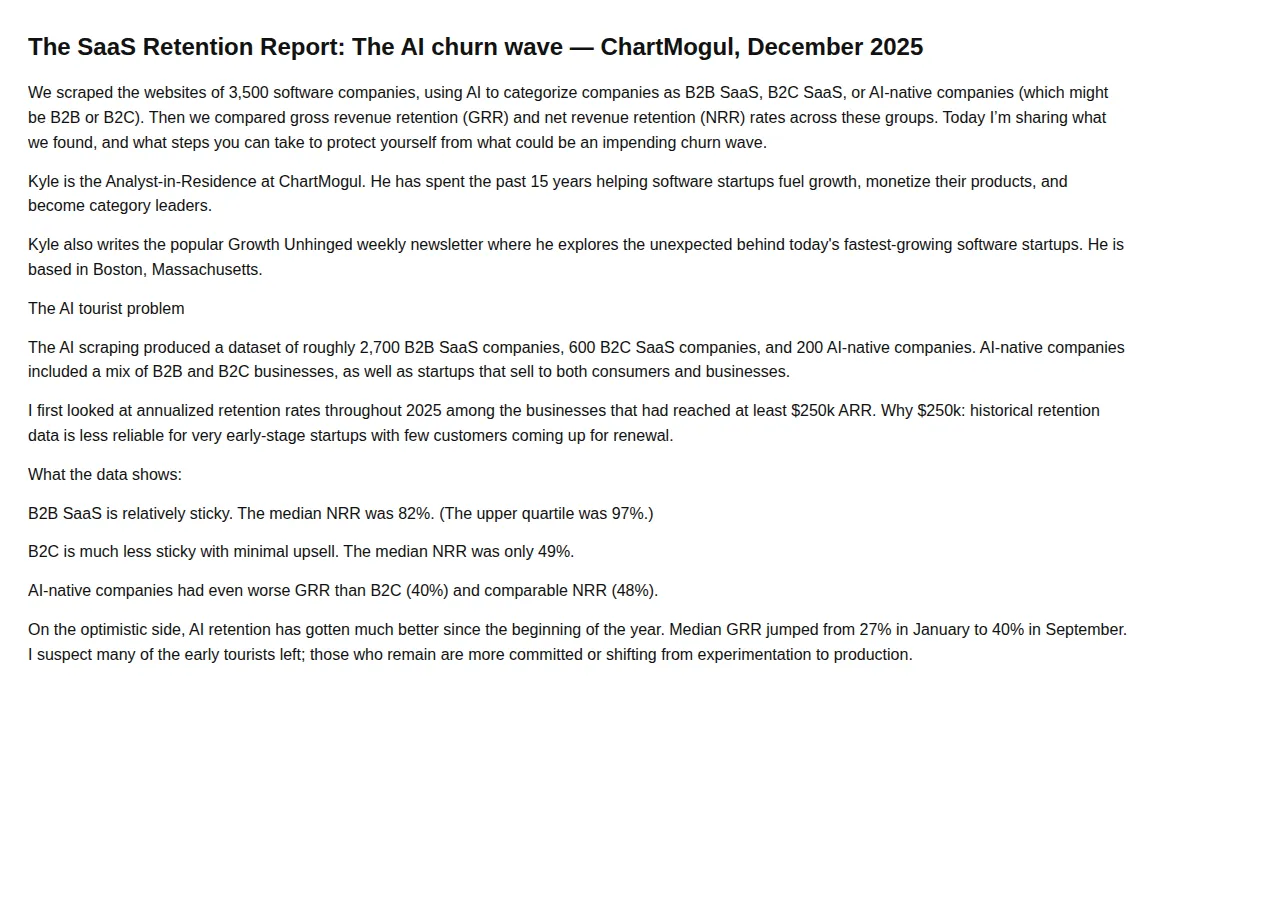
Churn is not a number. It is a curve: steep in the first three months, flattening after. ChartMogul's December 2025 retention report, built on 3,500 software companies, found median net revenue retention for B2B SaaS at or above $250,000 in ARR was 82 percent, with the upper quartile at 97 percent. B2C SaaS sat at 49 percent median NRR; AI-native companies posted 40 percent gross revenue retention and 48 percent NRR. Low-retention companies are three times as likely to be shrinking as to be growing quickly.
| Price point | Annual customer retention, top quartile | Best in class | Monthly churn | Authority |
| :--- | :--- | :--- | :--- | :--- |
| Over $500 per month | 85.7% | Above 93.1% | About 1.3% | ChartMogul, 2,100+ businesses |
| Under $10 per month | 63.1% | Above 74.9% | About 3.8% | ChartMogul Retention Report, 2,100+ businesses |
| B2B SaaS, median NRR | 82% | 97% upper quartile | — | ChartMogul, Dec 2025, 3,500 companies |
| B2C SaaS, median NRR | 49% | — | — | ChartMogul, Dec 2025, 3,500 companies |
| AI-native, median | 40% GRR, 48% NRR | 85% NRR above $250/mo | — | ChartMogul, Dec 2025, 3,500 companies |
Meridian Analytics, the worked example below, starts a month at $100,000 MRR, loses $3,500 to churn and $800 to contraction, and gains $6,200 in expansion. Gross revenue retention, which counts revenue before expansion, is 95.7 percent. Net revenue retention, which adds expansion back in, is 101.9 percent. ChartMogul defines NRR as MRR today from a customer cohort divided by MRR from that same cohort a year ago.
The 3:1 rule and what it actually means
David Skok states the rule in one sentence: LTV must be at least 3 times greater than CAC. It is a rule of thumb from a venture investor who watched hundreds of SaaS startups, not a theorem — and a startup whose long-term CAC is higher than its LTV will die, because every customer it wins destroys value.
!David Skok, For Entrepreneurs: LTV must be at least 3x greater than CAC
$
\text{LTV:CAC} = \frac{\text{Gross-Margin CLV}}{\text{CAC}}
$
The ratio needs a fully loaded CAC: total cost of sales and marketing divided by deals closed. Skok distinguishes two versions — marketing program costs only, and program costs plus the people and expenses of the sales and marketing organization. The second is the one that matters for any sales model with human touch.
| LTV:CAC band | Reading | Operator action | Authority |
| :--- | :--- | :--- | :--- |
| Below 1:1 | Every customer destroys value | Stop acquiring | Skok, For Entrepreneurs |
| 1:1 to 3:1 | Works, but with no room for error | Acquire selectively | Skok, For Entrepreneurs |
| 3:1 to 5:1 | Healthy unit economics | Scale acquisition | Skok, For Entrepreneurs |
| Above 5:1 | Possibly under-investing in growth | Test higher CAC | Skok, For Entrepreneurs |
CAC payback: the clock that matters
The ratio says whether a customer is worth winning. Payback says how long the business must fund the win before the customer starts paying for it. The formula is one division:
$
\text{CAC Payback (months)} = \frac{\text{CAC}}{\text{ARPU} \times \text{Gross Margin}}
$
The operating line is 12 months. Skok's cohort analysis makes the reason plain: the number that matters for payback is the share of customers still spending after 12 months. A payback inside a year means the customer has funded their own acquisition before the first renewal cycle is over.
Payback and the ratio are not the same test. A customer can pass the 3:1 ratio and fail payback: high lifetime value spread over a long life, bought with a large upfront CAC, is a cash-flow problem even when the economics are sound.
The discount rate: WACC or a stated flat rate
A dollar in month 28 is worth less than a dollar today. The Corporate Finance Institute defines a discount rate as the rate used to discount future cash flows back to present value — often a company weighted average cost of capital (WACC), the required rate of return, or the hurdle rate investors expect.
WACC is the honest choice for a company with debt and equity: it reflects the required return of both sets of investors. Its weakness is its inputs — it uses beta, a measure of historical volatility, and historical volatility is not necessarily a reliable indicator of future risk. A flat rate, commonly 10 percent a year in SaaS models, is the practical choice for a private company with no observable cost of capital, defensible only when stated as an assumption. No source in this article's research states 10 percent as an industry benchmark. The worked example below uses 10 percent a year, stated, so the reader can re-run it at 8 or 12.
Worked example: Meridian Analytics
Meridian Analytics sells a $120-a-month analytics workspace to mid-market teams: monthly churn 3.5 percent, gross margin 78 percent, fully loaded CAC $1,150, discount rate 10 percent a year, stated as an assumption.
Average lifetime is 1 divided by 0.035, or 28.57 months. Revenue CLV is $120 times 28.57, which is $3,428.57; gross-margin CLV is $3,428.57 times 0.78, which is $2,674.29. The LTV:CAC ratio is 2.33 to 1 — below the 3:1 line, in the grey zone.
Monthly gross profit is $93.60, so CAC payback is $1,150 divided by $93.60, which is 12.29 months — just past the 12-month line. Meridian fails both tests by a small margin.
The monthly discount rate is 10 percent divided by 12, or 0.8333 percent. Discounted CLV is $93.60 divided by (0.035 + 0.008333), which is $2,160.00; the discounted LTV:CAC ratio is 1.88 to 1. Discounting cuts the value by 19.2 percent.
The cohort survival curve at 3.5 percent monthly churn: 96.5 percent remain after month 1, 89.9 percent after month 3, 80.8 percent after month 6, 65.2 percent after month 12, and 42.5 percent after month 24. Annual customer churn is 34.8 percent. For comparison, ChartMogul's older data shows top-quartile companies above $500 a month keep 98 percent through month three, against 87 percent under $10 a month. Halve the churn to 1.75 percent and lifetime doubles to 57.14 months and gross-margin CLV doubles to $5,348.57.
| Monthly churn | Gross-margin CLV | LTV:CAC | Discounted CLV | Discounted LTV:CAC | Authority |
| :--- | :--- | :--- | :--- | :--- | :--- |
| 2.5% | $3,744.00 | 3.26:1 | $2,808.00 | 2.44:1 | Derived |
| 3.5% | $2,674.29 | 2.33:1 | $2,160.00 | 1.88:1 | Derived from stated Meridian inputs |
| 4.5% | $2,080.00 | 1.81:1 | $1,755.00 | 1.53:1 | Derived from stated Meridian inputs |
A second profile: Harbor Desk is a $29-a-month self-serve tool with 6.1 percent monthly churn — the ChartMogul median for customers below $25 ARPA — 82 percent gross margin, and $180 CAC. Lifetime is 16.39 months, gross-margin CLV $389.84, LTV:CAC 2.17 to 1, payback 7.57 months, discounted CLV $342.98, discounted ratio 1.91 to 1.
What ASC 340-40 does to your CAC
The LTV:CAC ratio uses cash CAC — the money actually spent. The income statement sees a different number, because ASC 340-40, Other Assets and Deferred Costs — Contracts with Customers, governs how the cost of winning a contract is recognized. Under ASC 340-40-25-1, an entity shall recognize as an asset the incremental costs of obtaining a contract if the entity expects to recover those costs. ASC 340-40-25-2 defines incremental costs as those not incurred if the contract had not been obtained — a sales commission is the standard example. Costs incurred regardless are expensed when incurred under ASC 340-40-25-3. The practical expedient in ASC 340-40-25-4 lets an entity expense incremental costs when incurred if the amortization period would have been one year or less; Deloitte notes it may not be applied selectively, and a business with 28-month average lifetimes, like Meridian, cannot use it.
ASC 340-40-35-1 requires amortization consistent with the transfer of the goods or services to which the asset relates. FASB staff guidance, as recorded by Deloitte, states the period could range from the initial contract term to the average customer life — and that the period might be, but should not be presumed to be, the entire customer life. If past experience indicates a renewal is likely, the period may extend beyond the initial term. The deferred revenue playbook covers the revenue side of the same timing question, and the ASC 606 guide covers the recognition rules that ASC 340-40 was written to match.
> [!WARNING]
> Capitalizing CAC does not make it free. A capitalized commission is an asset that must be recovered, and if the customer churns before the amortization period ends, the unamortized balance is impaired. A business that capitalizes aggressively and churns quickly will take the loss in a lump, in the worst possible quarter.
The calculation sequence
1. Pull the cohort: export every customer with start date, end date, monthly revenue, and segment as a CSV file.
2. Fix ARPU: divide total MRR by paying customers in the segment.
3. Measure churn by cohort: group by start month; compute survival at months 1, 3, 6, 12, and 24.
4. Compute average lifetime: take 1 divided by monthly churn; cross-check against median survival.
5. Build gross margin: revenue minus hosting, support, success, processing, and per-customer API costs.
6. Compute historical CLV: sum gross profit for finished cohorts, divide by customers.
7. Compute predictive CLV: apply the closed-form formula with segment churn and the stated discount rate.
8. Compute fully loaded CAC: total sales and marketing cost, including salaries and onboarding, divided by deals closed in the same segment.
9. Run both tests: LTV:CAC against 3:1, and CAC payback against 12 months.
10. Recompute on a schedule: monthly for churn and ARPU, quarterly for margin and CAC.
> [!TIP]
> Run the calculation per segment before you run it for the whole business. One blended CLV hides the segment that is losing money.
> [!FOUNDER]
> "CLV is the only number in marketing that cannot be argued with, because churn collects the debt. A team can debate brand, channels, and pricing — but the cohort survival curve is a receipt. Run the calculation per segment, state the discount rate in the open, and never let a blended average hide the segment losing money on every signup."
> — Enow A. Jovial, Founder & Chief Executive Officer
Who should not run this playbook
Fewer than six months of customer data: the survival curve has not formed, and the model extrapolates noise. One-off transactions with no repeat purchase have no lifetime to value; use contribution per order, not CLV. Negative gross margin means a negative CLV by definition. Monthly churn above 10 percent means a lifetime under 10 months; the math collapses into a payback question. A B2B business that cannot separate segments in the CRM should fix the CRM first.
The dunning and involuntary churn guide covers the failed-payment recovery that protects the retention curve this playbook measures, and the GA4 versus Mixpanel versus Amplitude comparison covers the analytics tooling that produces the cohort data. Run the final numbers through the ROI calculator before scaling spend on any segment that passed both tests.