PostHog vs Mixpanel vs Amplitude: Product Analytics Pricing at 100K, 1M & 10M Events
Product analytics pricing looks simple until the first invoice arrives. Every vendor counts something slightly different, every free tier ends at a different volume, and the number that matters most — what 10 million events a month costs — is published by only one of the three vendors here. This playbook prices PostHog, Mixpanel, and Amplitude from their own pricing pages, read on 2026-11-13, at 100,000 events, 1 million events, and 10 million events a month.
At 100,000 events and at 1 million events, all three cost zero dollars. At 10 million events they split: Mixpanel publishes an exact tier price, Amplitude publishes a structure with no dollar rate, and PostHog publishes the free allowance and a calculator but no per-event rate in the readable text of its pricing page.
What each vendor actually meters
An event is one recorded action: a button click, a page view, a signup, a purchase. But the meter is not the whole bill. Each vendor also meters the things around the event, and those meters decide whether the free tier holds.
PostHog meters per product: analytics counts events, replay counts recordings, flags count requests, surveys count responses. Each product carries its own free monthly allowance — 1M events for analytics, 5,000 session replays, 1M feature flag requests — and unused allowance does not roll over. When a billing limit is hit, additional events are permanently dropped.
Mixpanel meters events first and everything else second. Its Growth plan includes the first 1M events in the base price and bills additional events per its published breakdown, up to a 20M events-a-month ceiling; above 20M it is custom annual pricing through sales. Experiments are metered in monthly experiment users, abbreviated MEU. Warehouse connector events count toward the event limit like any other source, so a backfill can push you into the next tier.
Instrumenting any of the three starts the same way: drop the vendor's JS SDK into the site, or send JSON event payloads to the vendor API. The SDK batches events and the API returns a 200 per batch; a failed batch retries, so budget the resend in your event count. GDPR adds a second gate: confirm the data-processing addendum and the EU region before you instrument anything. Price the choice against CAC and LTV before you sign.
Amplitude meters events on Free and Plus, and adds monthly tracked users, abbreviated MTU, on Plus and above: a unique user who triggers one or more events in a calendar month. Plus scales to 700,000 MTU and 70M events. With few heavy users the event meter binds; with many light users the MTU ceiling binds first.
Founder & CEO Insight — Enow A. Jovial
The decision table
| Factor | PostHog | Mixpanel | Amplitude | Authority |
|---|---|---|---|---|
| Free events / month | 1M | 1M | 2M, forever | Vendor pages |
| Cost at 100K / month | $0 | $0 | $0 | Free tiers |
| Cost at 1M / month | $0 | $0 | $0 | Free tiers |
| Cost at 10M / month, annual | Calculator only | $840 | Custom quote | Mixpanel page |
| Cost at 10M / month, monthly | Calculator only | $1,176 | Custom quote | Mixpanel page |
| Replay, free tier | 5,000 / month | 10,000 / month | 10,000 / month | Vendor pages |
| Replay retention, free | 1 month | 30 days | 1 month | Vendor pages |
| Data retention, free | 1 year | Not published | 1 year | Vendor pages |
| Data retention, paid | 2 years; 3–7 years on packages | Not published | 2 years Plus; unlimited above | Vendor pages |
| Seats | Unlimited | Unlimited | Unlimited | Vendor pages |
| Entry to paid | Add a card; no fee | Growth from $0 | Plus from $0 | Vendor pages |
| Ceiling before sales | None published | 20M / month | 70M on Plus | Vendor pages |
Amplitude wins the free tier outright: twice the free events of the other two. Mixpanel wins transparency: the only vendor that prints a dollar price at every volume up to 20M. PostHog wins structural flexibility: per-product metering and billing limits, and no platform fee — but you must run the calculator to learn the number.
The free tiers, side by side
PostHog's free tier is the broadest in scope and the narrowest in volume: one project, 1-year data retention, community support, unlimited team members, and the full monthly free allowance on every product — 1M analytics events, 5,000 session replays, 1M feature flag requests. Usage stops at the free tier limits, so you cannot be charged by surprise. The constraint that bites first is usually the single project.
Mixpanel's free tier is the most generous on replay and the most restrictive on experiments: unlimited seats, up to 1M events a month, 10,000 session replays a month, up to 1,000 MEU a month for experiments, up to 10 active feature flags, and funnels and retention analysis. What it withholds matters: multi-touch attribution, custom properties, saved cohorts, and the query API.
Amplitude's free tier is the most generous on volume and the most complete as a platform: 2M events a month forever, no credit card, no time limit, with the full platform included at limited volumes. The caps are on depth: 10 saved charts, 1 space, 1 active experiment, 1 guide or survey live at a time, and 1-year data retention.
For the self-hosting alternative, where the meter disappears and the bill becomes server cost, see the self-hosting analytics comparison: PostHog, Plausible, and Umami.
Worked cost math at 100K, 1M, and 10M events
Every figure below is arithmetic on numbers published on the vendors' own pricing pages on 2026-11-13.
At 100,000 events a month, the bill is zero on all three: PostHog allows 1M free, Mixpanel allows 1M free, Amplitude allows 2M free. At 1 million events a month, the bill is still zero on all three — PostHog and Mixpanel allow exactly 1M free, and Amplitude's 2M allowance is only half used.
At 10 million events a month, Mixpanel is the only vendor with a published price.
The effective rate: $0.000084 per event across all events, and $0.0000933 per billable event once the free 1M is removed.
The second worked example is the step from 1M to 1.5M events, where most products first meet a bill: Mixpanel prices 1.5M events at $100 a month on annual billing and $140 a month on monthly billing, and only 500,000 events are billable.
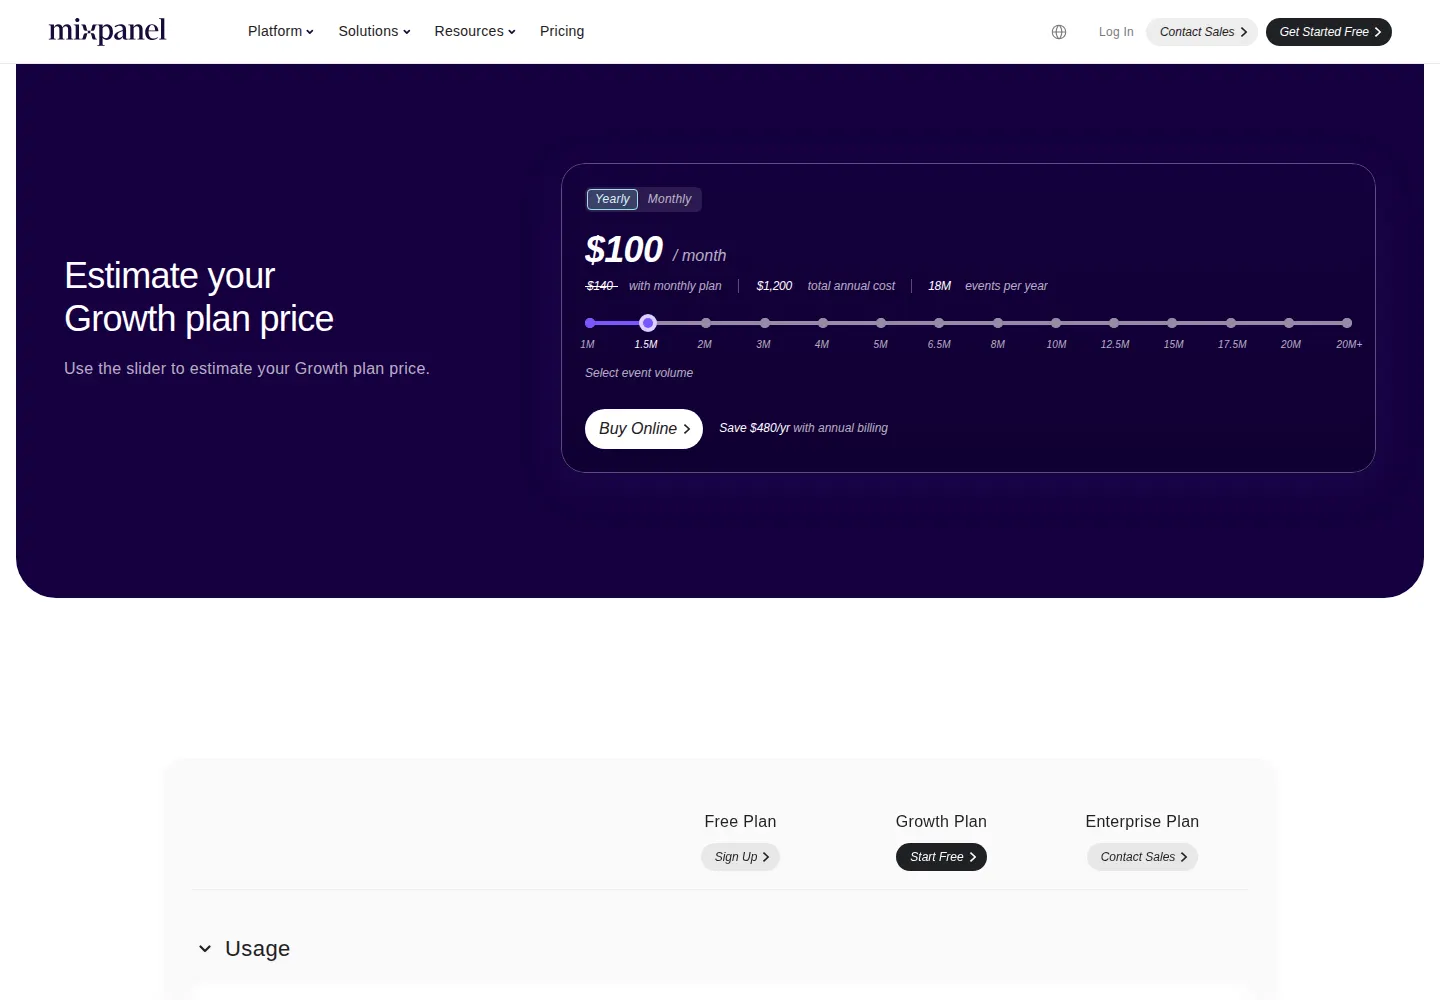
That $0.0002 per billable event at 1.5M versus $0.0000933 at 10M is the whole pricing story in one pair of numbers: Mixpanel's effective rate more than halves as volume grows from 1.5M to 10M. The tiers fall the same way — 2M costs $185 a month yearly, 3M costs $270, 5M costs $438.
Amplitude at 10M events is a quote, not a price. Plus starts at $0 with the first 2M events free and scales to 70M events, but the page publishes no per-event rate and no tier table between 2M and 70M. Do not carry a Mixpanel rate across to Amplitude; Amplitude's MTU ceiling can bind before its event ceiling. Get the Plus quote in writing with the MTU count attached.
PostHog at 10M events is a calculator run, not a price. The page publishes the free 1M events, the per-product structure, and the absence of a platform fee, minimum spend, and annual contract — but the per-event rate itself is rendered inside the on-page pricing calculator, not in the page text. Secondary sources disagree about the rate, with published figures ranging from $0.00005 to $0.000198 per event, which is why this playbook does not print one. Run the vendor calculator at your own volume and save the output.
Session replay and heatmaps: the second meter
Analytics events are the first meter. Session replay is the second, and it is the one teams forget to budget.
PostHog includes 5,000 session replays a month free and retains recordings for 1 month on the free plan. Replay is a separate product with its own meter, so a replay-heavy product can owe replay money while its analytics events are still free. Mixpanel includes 10,000 session replays a month on Free and 20,000 a month included on Growth, purchasable up to 500,000 sessions. Replay retention is 30 days on Free and Growth, and 7 to 360 days on Enterprise.
Amplitude includes 10,000 monthly session replays on Free and Plus, 20,000 on Growth, and 50,000 on Enterprise, with add-ons for more. Heatmaps are included on Plus and above, not on Free. Replay retention is 1 month on Free, Plus, and Growth, with an add-on for more on Growth and Enterprise.
Cap replay capture to the pages where a recording changes a decision — checkout, onboarding, and the worst funnel step. For the tagging layer that feeds all three tools, the Google Tag Manager vs Segment vs RudderStack pricing playbook prices the collection side at 1M, 10M, and 100M events a month.
Retention ceilings: the quiet price increase
Retention is the price increase that never appears as a dollar figure. It appears as a ceiling, and when you hit it, the choice is to pay for a higher tier or lose the history.
PostHog is the most explicit. Free keeps data 1 year; pay-as-you-go keeps it 2 years; platform packages extend retention to 3 years on Boost, 5 years on Scale, and 7 years on Enterprise. Recordings are retained 1 month on the free plan.
Amplitude is nearly as explicit. Free keeps data 1 year, Plus keeps it 2 years, Growth and Enterprise keep it unlimited.
Mixpanel does not publish a fixed event-retention ceiling. Its published retention numbers are for session replay: 30 days on Free and Growth, 7 to 360 days on Enterprise with a custom policy. Confirm the retention term in the order form before migrating history.
Run the decision
- Count events honestly: instrument the product for one week, read the event count from the vendor dashboard, and multiply by 4.33 for the month.
- Check the free allowance against the count: under 1M a month, all three are free for events. Between 1M and 2M, only Amplitude is still free. Above 2M, all three charge or require a quote.
- Price the 10M month before it arrives: take the Mixpanel tier price from the table above, get the Amplitude Plus quote in writing with the MTU count attached, and run the PostHog calculator at your own volume.
- Set the billing limits before launch: set PostHog billing limits above the launch-week forecast, set Mixpanel alerts at 5 per project on Growth, and confirm Amplitude's MTU ceiling against the user count.
- Cap replay at decision pages: enable replay on checkout, onboarding, and the worst funnel step only.
- Confirm retention in writing: confirm the retention term in the order form for Mixpanel, and the Plus 2-year term for Amplitude and the pay-as-you-go 2-year term for PostHog.
- Re-price every quarter: re-run the three numbers at the current volume. A tier that was expensive at 2M can be cheap at 10M, and a free tier that held at 1M can break at 2.5M.
Failure modes: how good analytics setups still go wrong
Most analytics billing failures are instrumentation failures with a price tag. The autocapture flood: autocapture records every click, and a chatty interface fires ten events per session that nobody queries. The warehouse backfill: a data warehouse connector backfills six months of history, and Mixpanel counts those events toward the monthly limit exactly like live events. The replay-everything default: replay runs on every page, the monthly session cap is exhausted in the first week, and the recordings that would have shown the checkout bug are never captured. The dropped-event silence: a PostHog billing limit set at the average month drops events during launch week.
Run the unit economics of the analytics bill with the Break-Even Analysis Calculator before deciding a paid tier is too expensive: a $840-a-month Mixpanel bill that saves one churned enterprise account pays for itself.
The decision in advance
The decision is a sequence, not a single price. Count events for a week, check the count against the free allowances, price the 10M month from the published tier and the two quotes, cap replay at decision pages, confirm retention in writing, and re-price every quarter. At 100K and 1M events the choice costs nothing. At 10M events only Mixpanel publishes the number — get the other two in writing before the volume arrives.