Attribution is bookkeeping, not truth. It splits a fixed pile of credit — one conversion, one sale — across the touchpoints on the path to it, and the rule you pick changes the answer without changing reality. The same $1,200 sale can make paid search look like a hero or a money pit depending on which model your dashboard is running. This guide works one conversion path through every live model, with the platforms' own current documentation, so you can read the number your dashboard prints and know what it actually means.
The correction most teams have not caught
Google retired the rules-based attribution models — first click, linear, time decay, and position-based — from Google Analytics 4 in November 2023. They are no longer available in GA4 at all. Any guide, dashboard template, or agency deck that still presents them as selectable GA4 options is describing a product that no longer exists. The models below are what each platform actually offers today, read from their own documentation on 19 November 2026.
| Platform | Models available today | Authority |
|---|---|---|
| Google Analytics 4 | Data-driven; Paid and organic last click; Google paid channels last click | Google Analytics Help, "Get started with attribution" |
| HubSpot | First Touch; Last Touch; Linear; Time Decay; Empirical | HubSpot Knowledge Base, "Create attribution reports" |
| Meta Ads Manager | Standard; Incremental; Custom | Meta Business Help Center, "About attribution models and attribution settings" |
One path, five answers
Take one conversion path and one $1,200 sale. The path is Organic Search, then Paid Social, then Email, then Paid Search. Watch what each rule does to the same sale.
| Model | Organic Search | Paid Social | Paid Search | |
|---|---|---|---|---|
| First click | $1,200 | $0 | $0 | $0 |
| Last click | $0 | $0 | $0 | $1,200 |
| Linear | $300 | $300 | $300 | $300 |
| Time decay (weights 1-2-4-8) | $80 | $160 | $320 | $640 |
| Position-based (40/20/40) | $480 | $120 | $120 | $480 |
The time-decay row uses doubling weights as an illustration — 1, 2, 4, 8 across the four touches, totalling 15 parts — because HubSpot defines time decay only as "more credit to interactions closer to the conversion" and publishes no fixed weights. The position-based row gives 40% to the first touch, 40% to the last, and splits the remaining 20% across the middle touches. The arithmetic is exact for the rule stated; the rule itself is the choice.
Now the money. Suppose paid search spent $400 to produce its part of this path. Under last-click attribution, paid search claims the whole $1,200 sale and its cost per acquisition is:
Under linear attribution, paid search claims one quarter of the sale — 0.25 conversions — and the same $400 of spend now reads as:
Nothing changed in the world. The spend is the same, the sale is the same, the customer is the same. The CAC quadrupled because the ruler changed. Run that comparison through our break-even calculator before you cut a channel: a channel that looks unprofitable under last click and profitable under linear is not two channels, it is one channel measured twice. Our LinkedIn vs Google Ads lead-cost playbook prices the paid side of this same problem, and our AI lead-scoring guide covers what happens after attribution — which leads the score says are worth chasing.
Google Analytics 4: three models, and the retirement that matters
GA4's Attribution reports offer exactly three models. Data-driven attribution is the default: it distributes fractional credit based on your property's own data, comparing converting and non-converting paths and using a counterfactual approach — what would the key-event probability have been without this touchpoint? Google's own illustration makes the mechanism plain: four ad exposures together give a 3% key-event probability, and removing the fourth drops it to 2%, so the fourth drives a 50% lift in probability. Conversions can be reattributed for up to 7 days after the conversion as data settles.
Paid and organic last click ignores direct traffic and gives 100% of the value to the last channel the customer clicked through before converting — or engaged-view through for YouTube. Google's examples are unambiguous: Display, Social, Paid Search, Organic Search gives 100% to Organic Search; the same path ending in Direct gives 100% to Paid Search; a path of Direct alone gives 100% to Direct. Paid and organic last click and "last non-direct click" are two names for the same model. Google paid channels last click gives 100% to the last Google Ads channel clicked, and falls back to paid and organic last click when the path contains no Google Ads click.
All three models exclude direct visits from receiving credit unless the path consists entirely of direct visits. The Attribution settings page exposes three controls: the reporting attribution model, the channels that can receive credit, and the key event lookback window. Set the lookback window deliberately: a 90-day window on a 7-day buying cycle credits touches that had nothing to do with the decision.
Meta: standard, incremental, and the windows that count
Meta lets you choose an attribution model and, for standard attribution only, attribution settings at the ad-set level. Standard attribution optimizes delivery for the selected time windows and user behaviours. Incremental attribution optimizes delivery for incremental conversions, using models that predict whether a conversion was caused by the ad. Custom attribution lets you share granular attribution data from your external analytics tool with Meta so delivery optimizes toward outcomes based on your own attribution logic.
For website and in-store conversions under the standard model, Meta's published windows are: click-through counts events within 1 day or 7 days after a link click; view-through counts events within 1 day after an impression; engage-through counts events within 1 day after a non-link click action — and for video, a play of 5 seconds, or 97% of the video if it is shorter than 5 seconds. Meta notes some accounts may still use prior versions of click-through and engage-through while the change rolls out. One thing Meta's article does not do is name a default setting for new ad sets, so this guide does not print one: check the setting on each ad set rather than assuming it.
Meta's Compare Attribution Settings feature lets you view reported conversions across 1-day view, 1-day click, 7-day click, and 28-day click regardless of the setting you optimized for — with iOS 14+ exceptions, and with the warning that a 28-day click view on a campaign live less than 28 days only provides partial data. That comparison is the cheapest diagnostic in paid social: if a campaign's story flips between 1-day click and 7-day click, the campaign is not driving decisions, it is harvesting them.
HubSpot: five models, and the sampling limit nobody reads
HubSpot still offers the full rules-based menu: First Touch gives all credit to the first interaction; Last Touch to the last before conversion; Linear splits equally; Time Decay weights recent interactions more heavily; Empirical gives credit based on how often each interaction type occurs across conversion paths, with rarer interaction types receiving more weight. The Empirical model replaces the U-shaped, W-shaped, J-shaped, and Inverse J-shaped models. HubSpot's example is the mechanism in miniature: if page views occur more often than form submissions across conversion paths, the Empirical model may assign more weight to form submissions because they are less frequent and more distinctive.
Three operational limits govern HubSpot attribution reports, and all three are published on the same page. Reports include up to 20 million interactions per report after sampling, with at least one year of interactions represented when available; high-frequency interaction types such as page views and email interactions are sampled down first, while form submissions, calls, and meetings are not sampled.
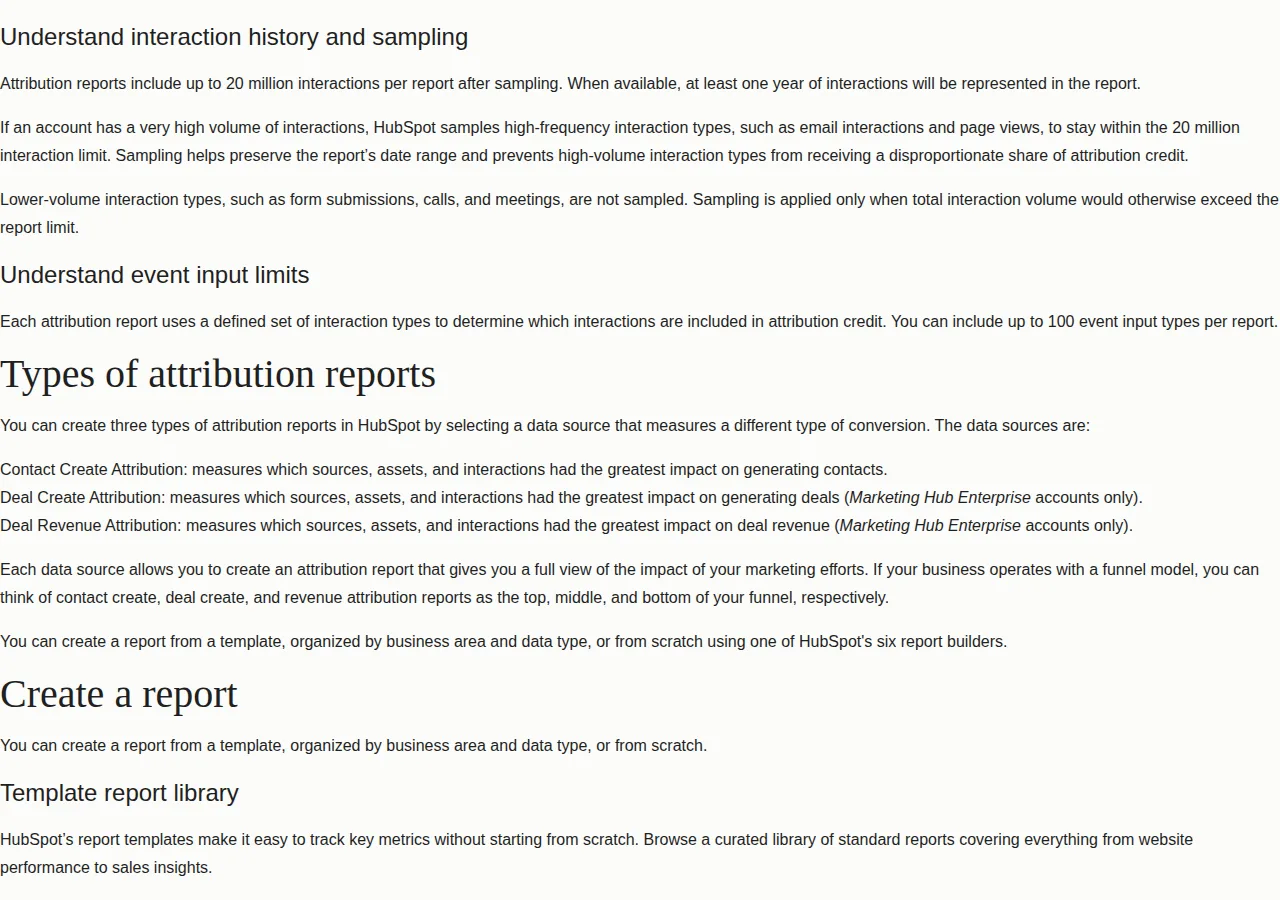 Each report accepts up to 100 event input types. And the report types are gated by tier: Contact Create Attribution is broadly available, but Deal Create Attribution and Deal Revenue Attribution require Marketing Hub Enterprise. A team on a lower tier that builds its whole attribution practice on revenue attribution is building on a report it cannot open.
Attribution is not incrementality
Attribution splits credit for conversions that happened. Incrementality asks whether the conversion would have happened without the channel. They answer different questions, and confusing them is the most expensive mistake in this field. A channel can win 100% of last-click credit for sales that would have happened anyway — branded search is the classic case — while contributing zero incremental revenue. Meta's incremental attribution model is built for exactly this: it optimizes for conversions its models predict were caused by the ad, not merely preceded by it. The honest test is a holdout: suppress the channel for a matched audience for two to four weeks and measure the difference in total conversions. No attribution model, however sophisticated, substitutes for that experiment. Use attribution to describe the journey; use holdouts to decide the budget.
Founder & CEO Insight — Enow A. Jovial
Failure modes worth naming before you reallocate
- The retired-model deck. Any report still showing first click, linear, time decay, or position-based as GA4 options is stale since November 2023. Rebuild it on the three live models.
- View-through inflation. A 1-day view window credits impressions that may have happened anyway. Compare 1-day click against 7-day click before crediting prospecting with view-through sales. Sync spend into the warehouse through the platform API, export the path data as CSV, query it with SQL, and judge the channel on CPA — a cheap CPA on view-through traffic is harvesting, not growth.
- The direct exclusion. GA4 gives direct no credit unless the path is entirely direct. A returning customer who typed the URL after three paid touches still shows as paid — which is correct bookkeeping and a reminder that "direct" in GA4 means "no tracked touch," not "no influence."
- Sampled reports. A HubSpot report over 20 million interactions samples page views first. If your conclusion rests on page-view-heavy paths, check whether sampling moved the answer.
- Cross-model comparison. Covered above, but it bears repeating as a failure mode rather than a footnote: two rows measured with different models are not two results, they are two languages.
Build checklist
- Name the model on every report. Write the model, window, and scope in the report title or first line. A report without a named model is a number without a unit.
- Rebuild any GA4 report still showing retired models. First click, linear, time decay, and position-based have been unavailable since November 2023; replace them with data-driven or paid and organic last click.
- Run the one-path exercise. Take a real $1,200 path from your own data and price it under each model your stack offers, using the table above as the template.
- Set the lookback window to the buying cycle. A 7-day cycle gets a short window; a 90-day enterprise cycle gets a long one. Never leave the default unexamined.
- Compare windows before moving budget. In Meta, run 1-day click against 7-day click; in GA4, run data-driven against paid and organic last click. If the story flips, the channel is harvesting, not driving.
- Check the HubSpot tier before promising revenue attribution. Deal Create and Deal Revenue Attribution need Marketing Hub Enterprise.
- Schedule one holdout per quarter. Attribution describes; holdouts decide. One suppressed-channel test per quarter is the minimum honest cadence.