Marketing Attribution Multi-Touch Playbook
Marketing Attribution Multi-Touch Playbook
Last-click attribution told a B2B software company that Meta closed nearly everything and LinkedIn closed almost nothing. First-touch told the same company the opposite. Both reports came from the same quarter, the same spend, the same 40 deals. Nothing about the customers changed — only the rule that handed out the credit. Attribution is not a report you read, it is a rule you choose, and every budget decision afterwards inherits that choice.
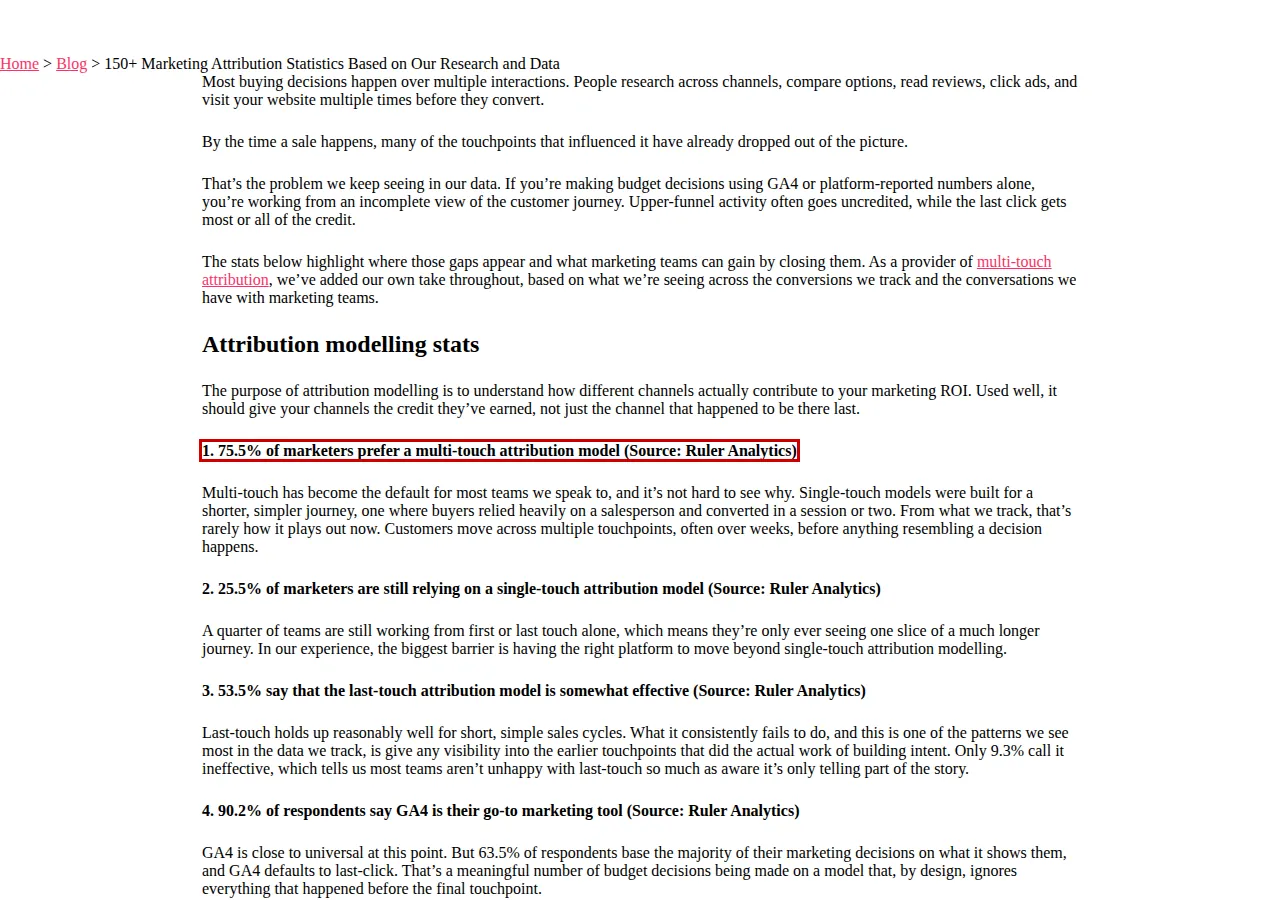
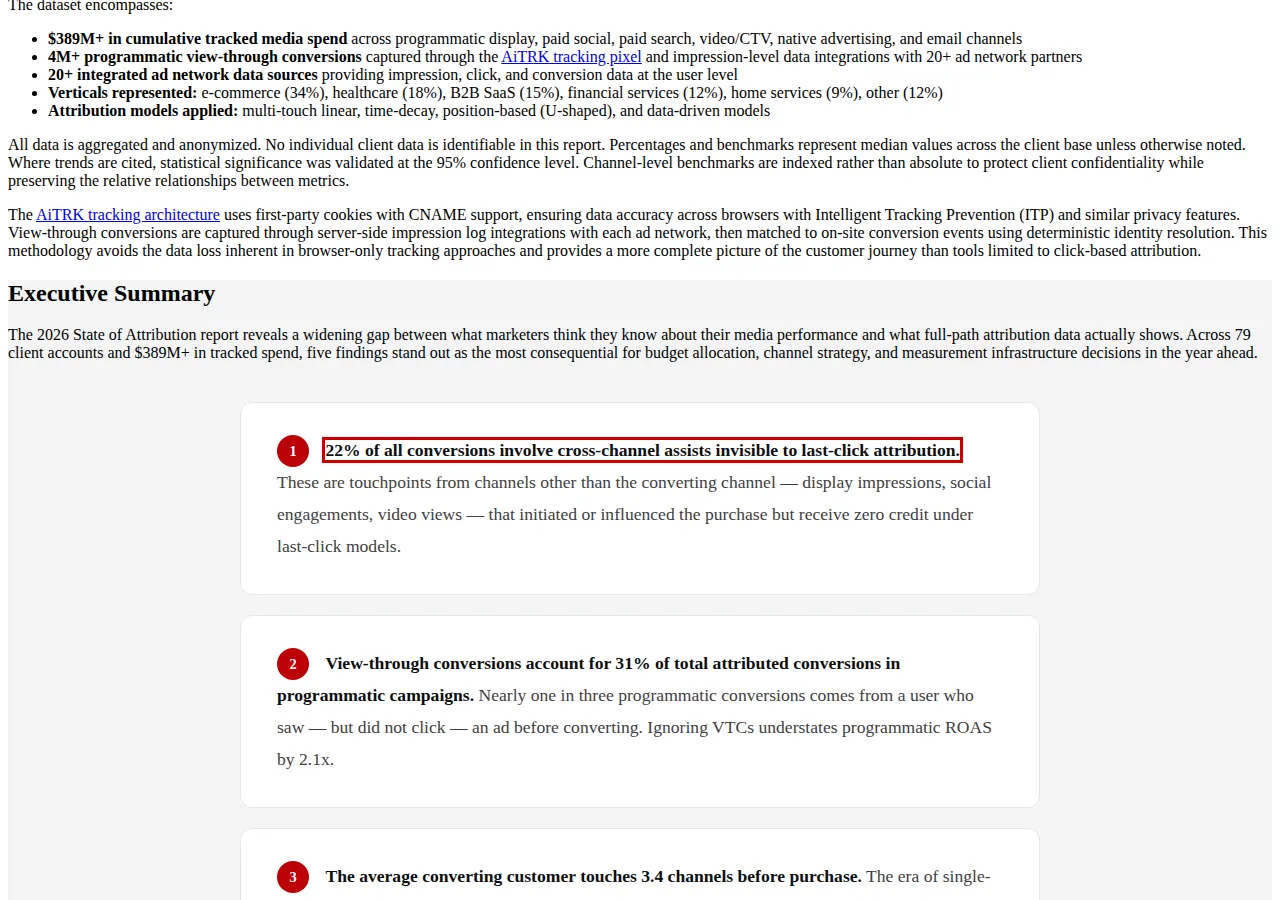
The stakes are not abstract. In AiTRK's 2026 State of Attribution report, built on 79 client accounts and more than \$389 million in tracked media spend, 22\% of all conversions involved cross-channel assists that last-click attribution cannot see at all, and the average converting customer touched 3.4 channels before buying. Only 23\% of conversions were single-touchpoint events. Ruler Analytics' 2026 survey found the same tension from the other side: 75.5\% of marketers prefer a multi-touch model, yet 25.5\% still rely on a single-touch model. Most teams know the model is wrong and keep using it anyway.
This playbook is an operations manual, not a theory piece. You will map real journeys, run five models on one quarter of stated numbers, set the windows in GA4 and Meta Ads Manager to match, fix your UTM discipline, and then test whether any of it was true with a geo-holdout. For channel return comparisons rather than credit, read the Google Ads vs Meta Ads ROAS playbook, the TikTok vs Meta ecommerce ROAS playbook, and the YouTube vs TikTok video ROAS playbook.
Step 1: Map the journey before you pick a model
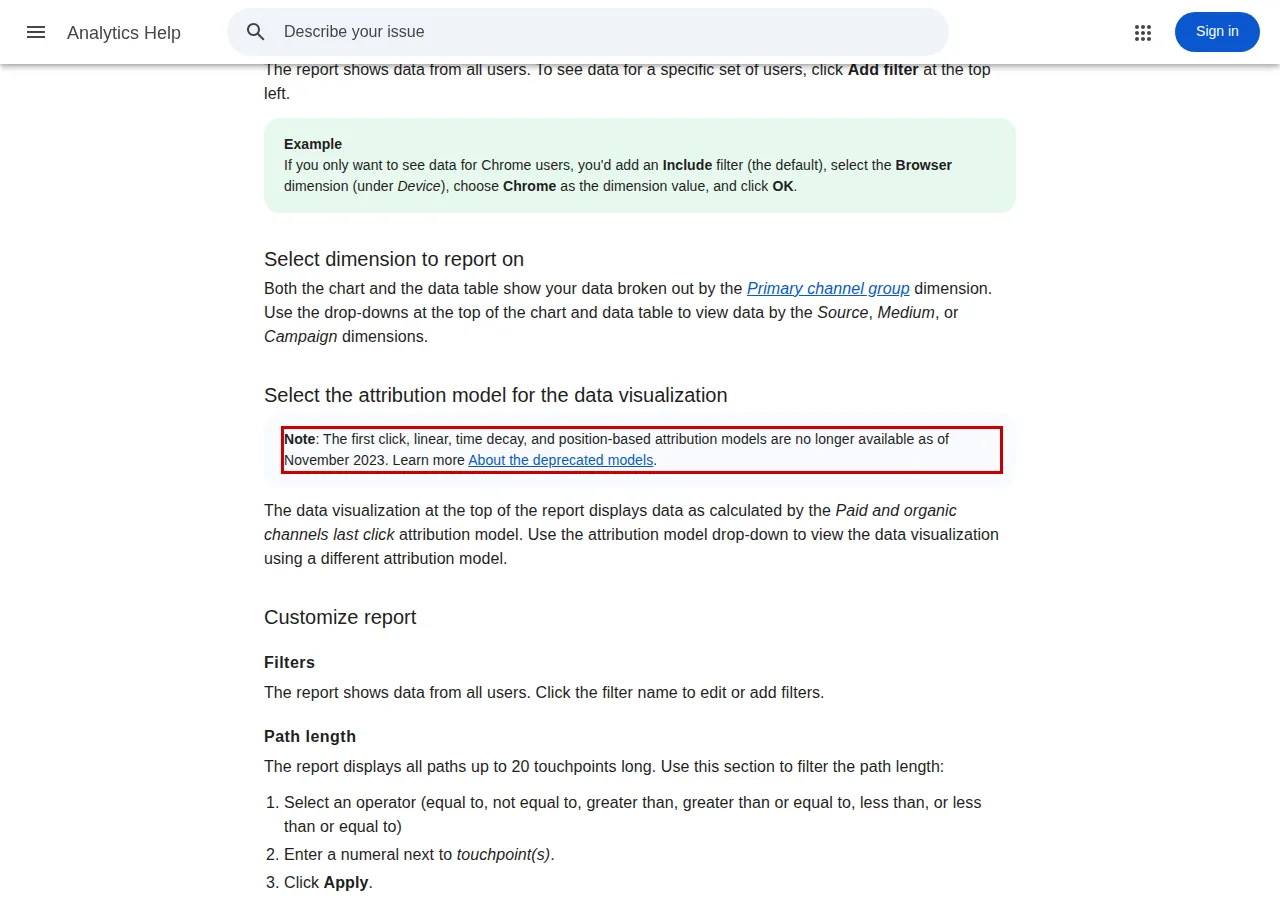
Open GA4, go to Advertising, then Key event attribution paths. The report shows the paths users take to complete key events — purchases, form submissions — and how credit is assigned to each touchpoint, with metrics for key events, purchase revenue, days to key event, and touchpoints to key event. Paths run up to 20 touchpoints long. If your cycle runs 40 touchpoints, GA4 truncates the path, so a long B2B cycle needs a CRM-backed path.
Before you touch a model, answer three questions from that report. First, how many touches does a conversion actually take? Second, how many days pass between first touch and conversion? Third, which channels appear early and which appear late? A channel that only ever appears first is a prospector; one that only ever appears last is a closer. Scoring a prospector on last-click is like scoring a striker on saves: the metric cannot see the job.
Step 2: Run five models on one quarter and watch the answer change
Here is the quarter, stated in full. A B2B SaaS company spends \$54,000 on paid media: Google Ads \$24,000, Meta \$18,000, LinkedIn \$12,000. It closes 40 deals worth \$240,000, an average of \$6,000 per deal. Twelve deals are single-touch — 8 from branded Google search (\$48,000) and 4 from Meta retargeting (\$24,000) — and count in full to their channel under every model. The other 28 deals (\$168,000) are multi-touch, on four three-touch paths:
- Path A, LinkedIn → Google Ads → Meta: 12 deals, \$72,000
- Path B, Google Ads → LinkedIn → Meta: 6 deals, \$36,000
- Path C, LinkedIn → Meta → Google Ads: 6 deals, \$36,000
- Path D, Meta → Google Ads → LinkedIn: 4 deals, \$24,000
First-touch gives all credit to the first touch. On the multi-touch revenue: LinkedIn opened paths A and C, 18 deals, \$108,000; Google opened path B, 6 deals, \$36,000; Meta opened path D, 4 deals, \$24,000. Last-touch gives all credit to the final touch: Meta closed paths A and B, 18 deals, \$108,000; Google closed path C, 6 deals, \$36,000; LinkedIn closed path D, 4 deals, \$24,000. Linear splits each deal equally across its three touches. Every path contains each channel exactly once, so linear gives each channel one third of the multi-touch revenue: \$56,000 each.
Time-decay weights touches by recency. Use stated weights of 1, 2, and 4 for the first, middle, and last touch: LinkedIn 46/7 deals (\$39,429), Google 62/7 deals (\$53,143), Meta 88/7 deals (\$75,429).
Position-based (U-shaped) gives 40\% to the first touch, 20\% to the middle, 40\% to the last. LinkedIn takes 10 deals (\$60,000), Google 8 deals (\$48,000), Meta 10 deals (\$60,000).
Add the \$72,000 of single-touch revenue back in:
| Model | Google Ads | Meta | Total | |
|---|---|---|---|---|
| First-touch | \$108,000 | \$84,000 | \$48,000 | \$240,000 |
| Last-touch | \$24,000 | \$84,000 | \$132,000 | \$240,000 |
| Linear | \$56,000 | \$104,000 | \$80,000 | \$240,000 |
| Time-decay (1-2-4) | \$39,429 | \$101,143 | \$99,429 | \$240,000 |
| Position-based (40/20/40) | \$60,000 | \$96,000 | \$84,000 | \$240,000 |
The time-decay row sums to \$240,001 after rounding to whole dollars; unrounded it is exactly \$240,000.
Every row totals \$240,000 — each model redistributes the same revenue; only the distribution moves. Divide attributed revenue by spend:
LinkedIn returns \$9.00 per \$1 under first-touch (\$108,000 ÷ \$12,000) and \$2.00 under last-touch (\$24,000 ÷ \$12,000). Meta returns \$2.67 under first-touch and \$7.33 under last-touch. The same channel, the same quarter, a 4.5-times swing for LinkedIn and a 2.75-times swing for Meta, decided entirely by the model. Google Ads is stable at \$3.50 under both single-touch models — a channel that looks the same under first- and last-touch is doing balanced work across the journey.
Two guardrails keep this honest. First, never add platform-reported revenues together. In this quarter the platforms would claim roughly \$95,000 (Google), \$140,000 (Meta), and \$110,000 (LinkedIn) — \$345,000 of claimed revenue against \$240,000 that actually exists, an overcount of \$105,000, or 43.75\%. Second, keep the blended numbers beside the modelled ones: \$60,000 total spend ÷ 40 deals = \$1,500 per deal, and \$240,000 ÷ \$60,000 = \$4.00 per \$1. If a model's story contradicts the blended story, the model is the suspect.
Step 3: Face what GA4 actually does now
Google retired the rule-based models. GA4's own help page states that the first click, linear, time decay, and position-based attribution models are no longer available as of November 2023, and that the data visualization in the attribution paths report is calculated by the paid and organic channels last click model. In practice, data-driven attribution is the default where available, with paid and organic last click as the fallback most small teams see.
Data-driven attribution is not a rule you can write on a whiteboard. It uses machine learning on your own conversion paths to assign fractional credit, so the same touch can earn different credit in different months as the data changes. That is a strength and a hazard: a channel's reported performance can move with no change in the channel. Our editorial analysis found the practical response is to read GA4's data-driven view for direction and keep a rule-based model — linear or position-based — as the stable reference.
Step 4: Set Meta's windows to match your sales cycle
Meta's attribution setting is set per ad set, and it does two jobs at once: it decides which conversions Ads Manager counts, and on the standard model it steers delivery toward the conversions it counts. The default is 7-day click and 1-day view: a conversion counts if it happens within 7 days of a link click or within 1 day of a view without a click. Click-through runs 1 or 7 days; view-through and engage-through — a like, share, save, or a video played for 5 seconds — run 1 day. Since March 2026, click-through counts link clicks only; other clicks moved into engage-through. These windows are per Brandrocket's guide to Meta's settings, since Meta's own help page would not load.
A 7-day click window fits a purchase that usually happens within a week; a B2B SaaS trial that takes 30 days to close will have most of its conversions fall outside the window entirely, and Ads Manager will report the campaign as a failure while the CRM quietly books the deals. Match the window to the cycle from Step 1: 1-day click for impulse buys, 7-day click for considered purchases, 7-day click only for a stricter read. Use the Compare Attribution Settings columns to see the same ad set under 1-day click, 7-day click, and 1-day view side by side, with no effect on delivery. Comparing ad sets on different settings is meaningless, so standardize the setting across every ad set you compare.
Meta also offers incremental attribution, which optimizes for conversions its models predict would not have happened without the ad; data exists only from 1 April 2025, and it is Meta grading Meta — the verdict belongs to the holdout in Step 6.
Step 5: UTM discipline — the unglamorous step that decides everything
Every model above is garbage if the touches are mislabelled. GA4 reads traffic through five UTM parameters — utm_source, utm_medium, utm_campaign, utm_id, and utm_source_platform — and when manual tagging and auto-tagging are used together, Google Analytics uses the auto-tagged values for source, medium, and other traffic-classification dimensions. Tag everything by hand with one convention, and stop auto-tagging overwriting it where manual values matter.
The convention is a written document, not a habit. Lowercase only, hyphens not underscores, no spaces, no campaign names that change spelling week to week. utm_source names the platform (google, meta, linkedin), utm_medium names the mechanism (cpc, social, email), utm_campaign names the offer and the quarter. Keep a master list in a CSV — one row per campaign, with source, medium, campaign, owner, and start date — and make the CSV the only place new campaign names are created. Audit monthly: export GA4's source/medium/campaign combinations and fix one-off spellings that split one campaign into two. HubSpot's attribution models — first touch, last touch, linear, time decay, U-shaped, W-shaped, J-shaped, inverse J-shaped, and an empirical model that weights interaction types by how often they occur across conversion paths — all depend on the same labelled touches.
Step 6: Prove it with a geo-holdout
Attribution assigns credit; only an experiment tests causation. A geo-holdout switches spend off in matched regions and compares total sales with regions where spend continued. GeoLift best practice calls for 52 weeks of daily regional sales, 20 or more regions, and at least 15 days of testing on daily data. Worked example, stated in full: 20 regions, 10 test and 10 control. Pre-test weekly revenue was \$52,000 in test regions and \$48,000 in control regions. Over a 4-week test, control regions took \$200,000 while test regions, with \$10,000 of spend, took \$230,000.
That is \$13,333 of incremental revenue — a 1.33 return, a 6.15\% lift — against the platform's claimed \$18,000, a 1.80 return that overstates the causal result by 35\%. Google's Conversion Lift needs a \$5,000 minimum budget and at least 150 conversions in treatment and 65 in control, reported with an 80\% credible interval. If you cannot isolate 20 comparable regions, run a platform lift study instead: one city against one city is a comparison, not an experiment. Before you move budget on the result, run the numbers through the ROI calculator.
Founder & CEO Insight — Enow A. Jovial
Step 7: Reconcile attribution to the books
Attributed revenue is not booked revenue. Under GAAP, revenue is recognized when earned, not when a platform claims a click, so your CPA should reconcile attributed revenue to the CRM pipeline and to bank deposits every month — and the reconciliation is where double-counted platform revenue gets caught. The business may be an LLC, an S-Corp, or a C-Corp, but the model choice does not change with the entity; what changes is who signs the agency contract and whose EIN sits on the vendor W-9. Pay agencies by ACH, keep every platform export as a CSV, and pull spend through the platforms' API into the CRM so Step 2 can be rebuilt by anyone.
Who this is for — and who should skip it
This playbook fits a business spending on two or more paid channels with a sales cycle longer than a day and a CRM that records revenue. Skip it if you run one channel, sell in a single session, or cannot tie revenue to a customer record — a single-touch model is cheaper and just as true for you.
Which model, when
| Model | Use it when | Authority |
|---|---|---|
| First-touch | Funding prospecting | HubSpot: first touch |
| Last-touch | Short cycles; single-session sales | GA4: paid and organic last click |
| Linear | Stable multi-touch reporting | HubSpot: linear, equal credit |
| Position-based | First and last matter most | HubSpot: U-shaped |
| Data-driven | Enough volume for fractional credit | GA4 attribution paths report |
| Geo-holdout | Before big budget moves | Meta GeoLift; Google Conversion Lift |
- [x] Export GA4 paths; record median touches and days to conversion.
- [x] Write down your model choice and date.
- [x] Rebuild the model comparison on last quarter's real numbers.
- [x] Standardize Meta attribution settings across comparable ad sets.
- [x] Lock the UTM convention in a CSV; audit monthly.
- [x] Reconcile attributed revenue to CRM pipeline and bank deposits.
- [x] Run one geo-holdout per channel per quarter.
Pick the model, write it down, test it with a holdout. Everything else is a platform telling you what you want to hear.