Log Management: Grafana Loki vs Elasticsearch Playbook
Log Management: Grafana Loki vs Elasticsearch Playbook
Every log line carries two prices: writing it down and finding it again. Grafana Loki and Elasticsearch charge those two prices in opposite ways. Loki indexes only the labels on a log line and compresses the rest into chunks in object storage, so writing is cheap and finding anything that is not a label means scanning chunks. Elasticsearch indexes every field, so finding is fast and writing carries the full cost of the index.
This playbook prices both systems from the vendors' own list rates, read 12 November 2026, at three ingest profiles: 10 GB a day for a small team, 100 GB a day for a mid-size service, and 500 GB a day for a large one. It then covers indexing, retention, and query language, and ends with a decision rule for your own volume. All rates are list prices before tax, quoted as "starts at" or "as low as" volume-tiered floors; worked numbers are derived arithmetic on stated assumptions. For the wider observability bill, see the Datadog vs Grafana Cloud vs New Relic observability pricing playbook.
Step 1: Measure your ingest profile before you price anything
Neither vendor sells "log management" as one number. Both meter volume, and your daily ingest in gigabytes is the single input that decides the bill. Measure it from your shipper for a full week: count the bytes your agents send after compression; both vendors bill on arriving volume.
Three profiles anchor this playbook: A is a small team at 10 GB a day, B a mid-size service at 100 GB a day, C a large deployment at 500 GB a day. Monthly volume is daily ingest times 30 days. Profile A sends 300 GB a month, B 3,000 GB, C 15,000 GB. If your measured ingest falls between profiles, price it the same way: multiply daily gigabytes by 30, then run the meter math in Steps 2 and 3. A 30-day retention window is assumed throughout — the Grafana Cloud Pro default.
Step 2: Price Grafana Cloud Logs — three meters, one dominant charge
Grafana Cloud Logs runs on Loki and bills on three meters: process, write, and retain. Pro list rates, read from Grafana's pricing page on 12 November 2026: \$0.05 per GB processed, \$0.40 per GB written, and \$0.10 per GB retained per month. The \$19 monthly platform fee includes 50 GB ingested per month; the free tier allows 50 GB a month with 14 days of retention, Pro retention 30 days. The write meter decides the bill at eight times the process meter.
Worked math for Profile B, 100 GB a day: 3,000 GB a month, 2,950 GB billable after the included 50 GB:
Total: \$19.00 + \$147.50 + \$1,180.00 + \$300.00 = \$1,646.50.
The same arithmetic at all three profiles:
| Profile | Daily ingest | Monthly GB | Billable GB | Process | Write | Retain | Monthly total |
|---|---|---|---|---|---|---|---|
| A | 10 GB | 300 | 250 | \$12.50 | \$100.00 | \$30.00 | \$161.50 |
| B | 100 GB | 3,000 | 2,950 | \$147.50 | \$1,180.00 | \$300.00 | \$1,646.50 |
| C | 500 GB | 15,000 | 14,950 | \$747.50 | \$5,980.00 | \$1,500.00 | \$8,246.50 |
At Profile B the write meter is 71.7\% of the bill — that share is the point. Grafana's Adaptive Logs identifies log patterns your queries never touch and recommends dropping them, with the vendor claiming ingest can be cut by up to 50\%. If dropping halves the written and retained volume while processed volume stays on arrivals, Profile B falls to \$906.50 a month.
A \$740.00 monthly saving, or 44.9\%, from dropping data nobody reads. The lever only works if the dropped patterns are truly unread; drop one an incident later needs and the saving turns into a blind spot.
Step 3: Price Elastic Cloud Serverless — two meters, lower list rates
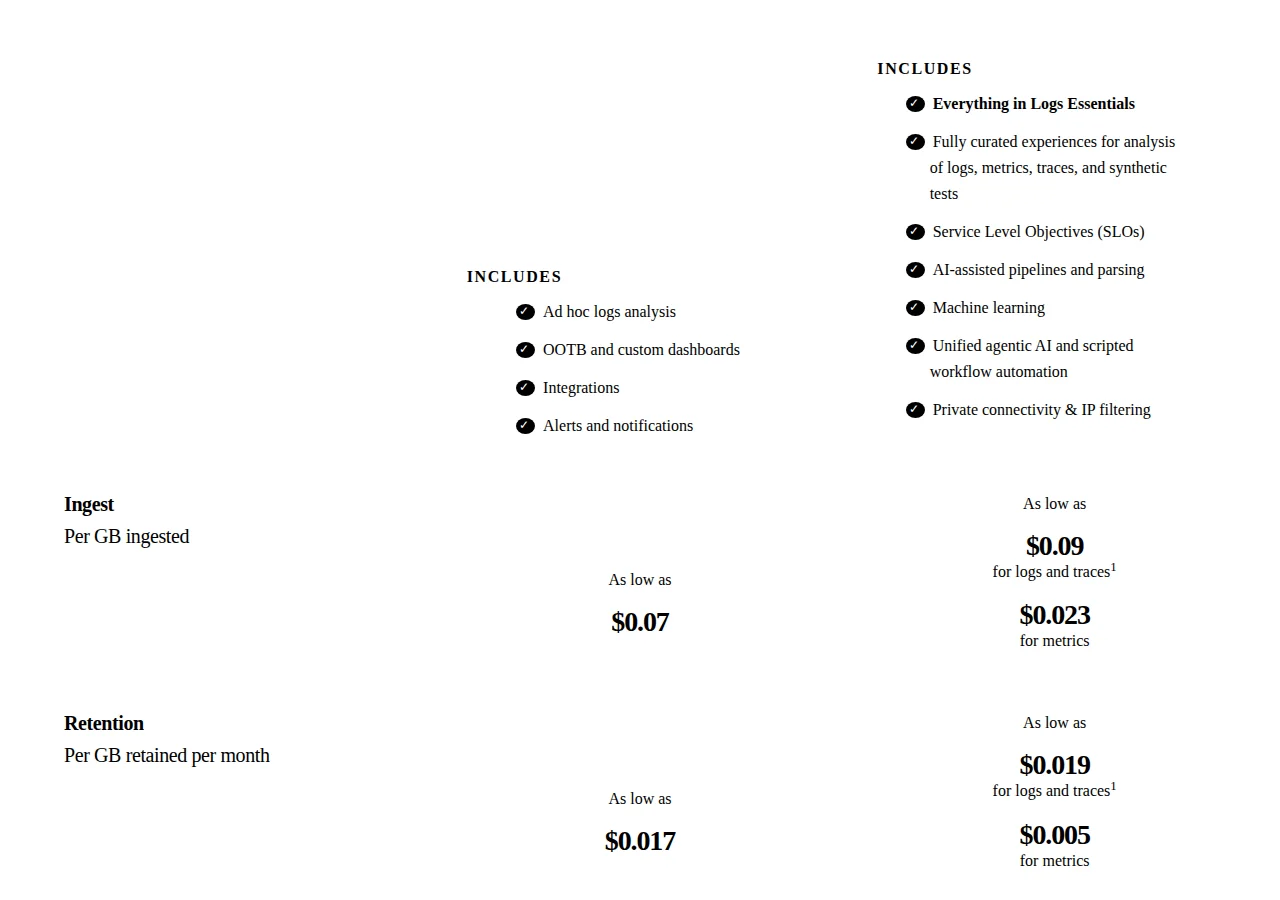
Elastic Cloud Serverless for observability bills on two meters: ingest and retention per GB per month. The Logs Essentials tier, read from Elastic's pricing page on 12 November 2026, lists ingest as low as \$0.07 per GB and retention as low as \$0.017 per GB per month. The Complete tier lists \$0.09 per GB for logs and traces, \$0.023 for metrics, and \$0.019 retention per GB per month for logs and traces. Egress carries 50 GB free, then \$0.05 per GB. Neither tier has a platform fee or per-seat charge. For Profile B on Logs Essentials:
Total: \$210.00 + \$51.00 = \$261.00.
The same arithmetic at all three profiles, Complete shown for comparison:
| Profile | Grafana Pro | Elastic Essentials | Elastic Complete | Grafana vs Essentials |
|---|---|---|---|---|
| A, 10 GB/day | \$161.50 | \$26.10 | \$32.70 | 6.19x |
| B, 100 GB/day | \$1,646.50 | \$261.00 | \$327.00 | 6.31x |
| C, 500 GB/day | \$8,246.50 | \$1,305.00 | \$1,635.00 | 6.32x |
At Profile B the annual gap is \$16,626.00 — read it carefully. Both vendors quote "as low as" floors tied to volume tiers. Elastic's rate buys full indexing of every field; Grafana's write meter buys label-only indexing with chunk scanning. Elastic Cloud Hosted is the third option: it bills on provisioned resources, primarily GB RAM-hour, rather than per GB ingested. Run your own profile through the ROI calculator before committing.
Step 4: Compare the indexing bet — labels and chunks against full-field index
Price follows architecture. Loki indexes only the labels on a log line, in the Prometheus style, and stores the lines compressed in chunks in object storage such as S3 or GCS. A small index and highly compressed chunks simplify the operation and lower the cost. Elasticsearch maps fields dynamically at ingest and indexes them, so any field is searchable without a scan.
Every unique combination of label values creates a new stream, stored and indexed separately. Grafana's docs say to use labels only for low-cardinality dimensions you always filter on — env, cluster, namespace, app, job — and never for high-cardinality values such as pod, instance IDs, request IDs, user IDs, trace IDs, HTTP status codes, or IP addresses. Loki 3.0 added structured metadata for high-cardinality pairs; fields parsed at query time add no indexing overhead.
Worked stream math: four labels with 3 environments, 4 clusters, 20 namespaces, and 50 applications produce:
Add pod as a label across 2,000 pods:
Twenty-four million streams is the failure the docs warn about: each stream costs memory in the ingester and entries in the index. The fix is discipline, not hardware — move the pod name into the log line and parse it at query time.
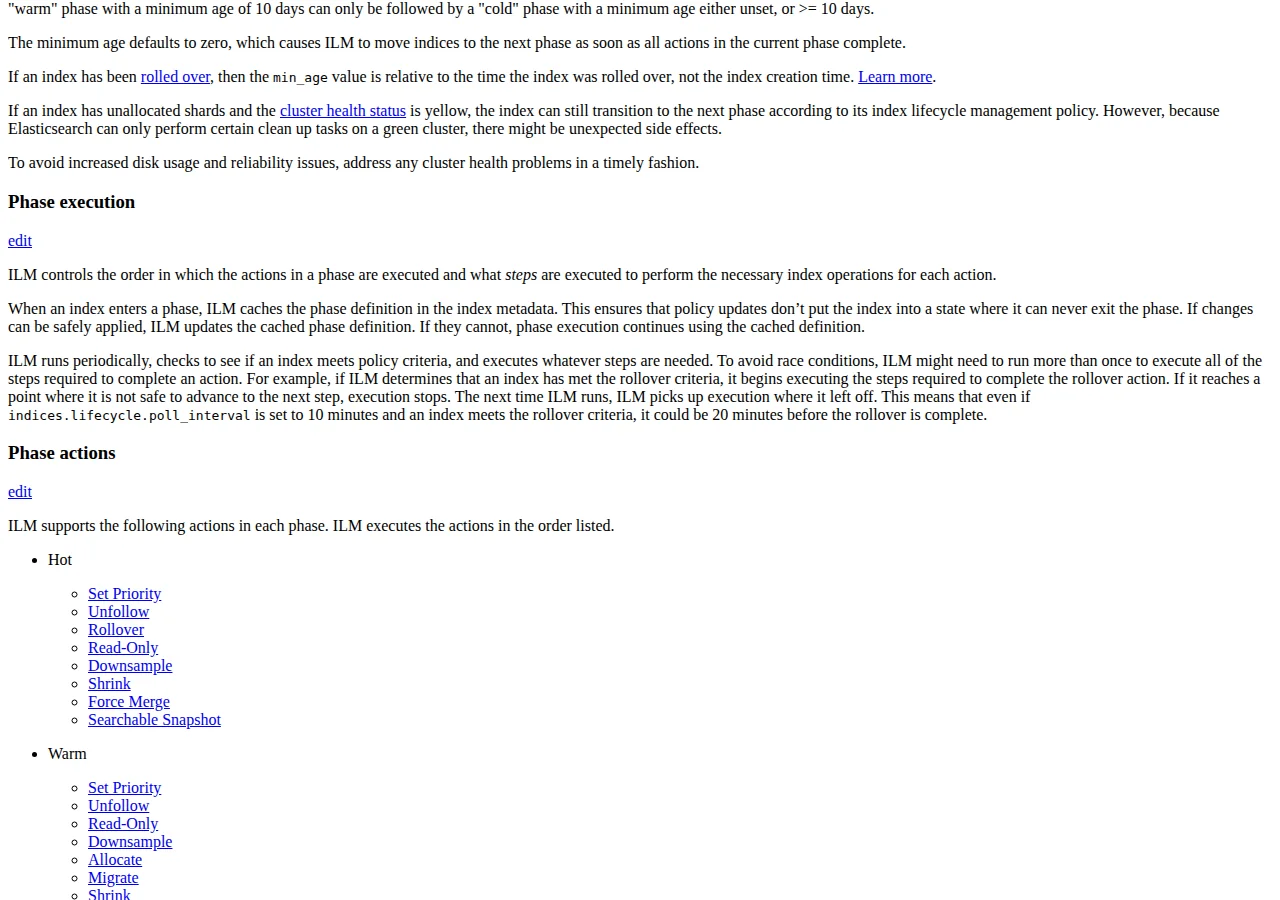
Elasticsearch pays the same cardinality bill in a different place: every field is indexed, so a new field with many distinct values grows the index and the heap that serves it. The control is Index Lifecycle Management (ILM), which moves indices through five phases by age: hot, warm, cold, frozen, and delete. Each phase's minimum age is measured from rollover, not from index creation.
Elastic's worked example shows what the ladder is worth. For a 1,000-host workload at 86.4 GB a day with 30 days of retention and one replica, a single-tier cluster needs 5.184 TB and costs \$3,772.01 a month. A hot-warm deployment with an ILM policy — seven days hot with a replica, the rest warm without one — costs \$1,491.05 a month, saving \$2,280.96, or 60.5\%.
Adding rollups that summarize 10-second data into hourly documents after seven days cuts the bill to \$1,024.92 — a 72.8\% saving against the single-tier cluster. The same ladder collapses further at very large scale: Elastic's hot-to-frozen pattern keeps one day on SSD, the rest in frozen searchable snapshots on blob storage, and its benchmark of 105 TB of logs over 90 days held frozen Discover queries within single-digit seconds at p99.9 while costing roughly 16 times less than keeping the full dataset on hot nodes. Where the data lives changes what the query layer can do — the Cloudflare Workers plus D1 versus Hyperdrive edge SQL benchmark shows it on the database side.
Step 5: Learn the query language you will live in
A log system is a query language with a storage bill attached. LogQL is Loki's language, built on the PromQL pattern: a stream selector in braces picks the labels, then line filters work on the content. A query for 5xx errors from checkout reads:
{app="checkout"} |= "error" | json | status=~"5.."
The selector should be as specific as possible: it decides how many chunks Loki opens. A rate over five minutes uses a metric query:
sum(count_over_time({app="checkout"} |= "error" [5m]))
Elasticsearch offers four languages. Query DSL is the primary JSON-style language for complex queries. ES|QL, introduced in 8.11, is a piped language for filtering, transforming, and analyzing data. KQL is the Kibana text language for filtering in Discover and dashboards: it filters only, with no role in sorting or aggregating, and no support for regular expressions or fuzzy terms. Lucene syntax is the original text syntax. A KQL filter for error responses reads:
http.response.status_code:400 401 404
The equivalent Query DSL is a JSON bool query with match clauses. That split is the real difference: LogQL rewards the operator who thinks in labels and time windows, while Query DSL and ES|QL reward the operator who thinks in fields and aggregations.
Founder & CEO Insight — Enow A. Jovial
Step 6: Set retention so the bill and the audit both pass
In Loki, retention is handled by the Compactor. The docs give a minimum working configuration: retention enabled under the compactor block, with a retention period in the limits block — 360 hours, or 15 days, in the example.
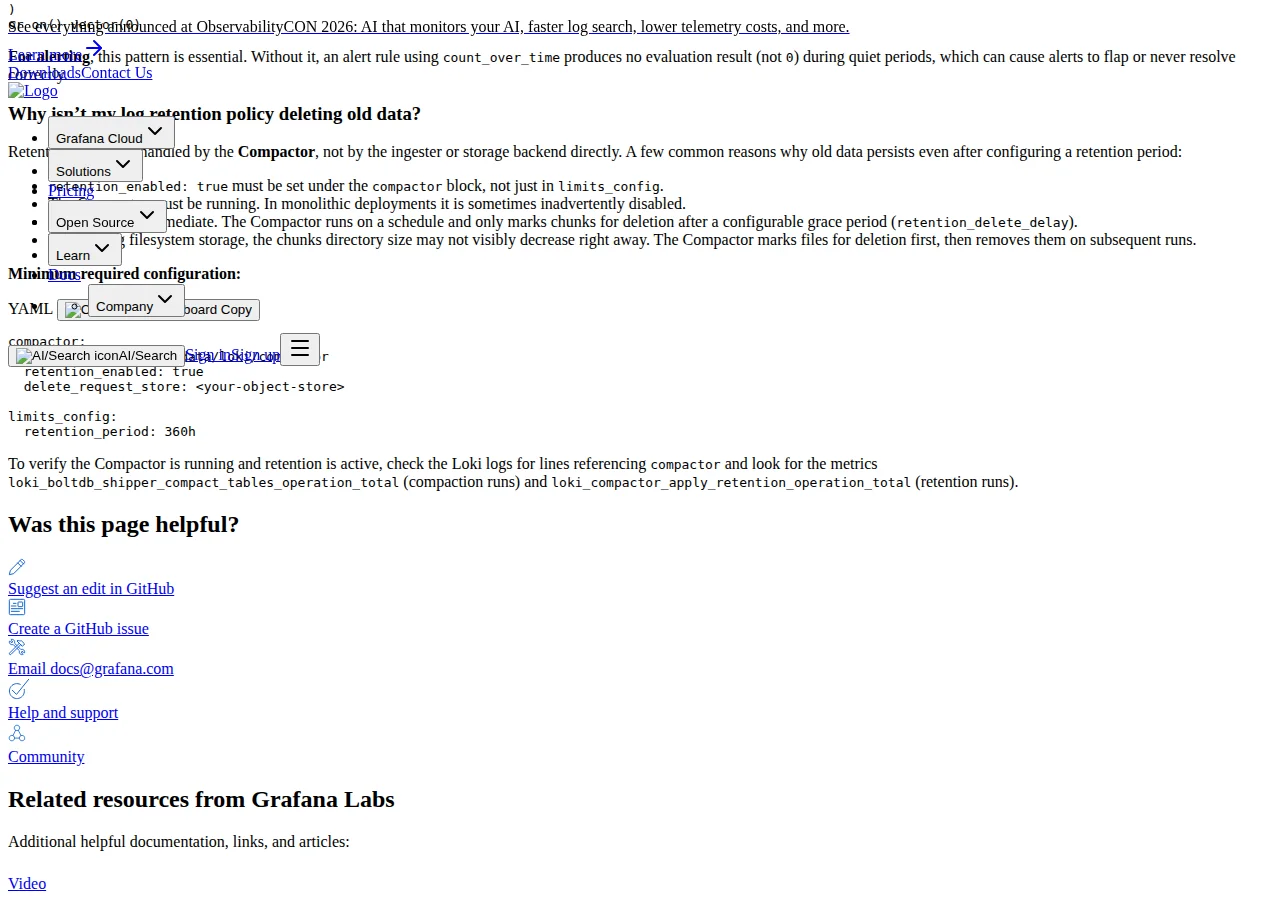
Deletion is not immediate — the Compactor marks chunks for deletion after a grace period — and if the Compactor is disabled, Loki deletes nothing. That is the most common retention failure in self-hosted Loki: the period is set, the Compactor is off, and disk fills. On Grafana Cloud the vendor runs it.
In Elasticsearch, retention is the delete phase of the ILM policy, and the tier ladder keeps data searchable long after it stops being hot. Frozen indices are partially mounted searchable snapshots: read-only, stored on blob, queried without a restore step. For audit workloads keeping a year of logs searchable but almost never read, frozen is the cheapest searchable tier Elastic offers.
Step 7: Decide with a rule, then migrate in slices
Choose Loki when your queries start from labels you can name in advance, volume is high and mostly unread, and your team thinks in PromQL. Choose Elasticsearch when the incident question is unknown until it happens, or auditors need to search any field. Choose Serverless when you want the meter to follow volume; Hosted when you want fixed capacity.
| Situation | Pick | Why | Authority | ||
|---|---|---|---|---|---|
| High volume, mostly unread, known labels | Grafana Cloud Logs | Write meter dominates; Adaptive Logs drops unread patterns | Grafana pricing page | ||
| Unknown incident questions, any-field search | Elastic Serverless | Every field indexed; ingest plus retain only | Elastic Serverless pricing page | ||
| Year-long audit retention, rarely read | Elastic Hosted, hot-to-frozen ILM | Frozen snapshots; about 16x cheaper than all-hot | Elastic hot-to-frozen blog | ||
| Team already writes PromQL | Grafana Cloud Logs | LogQL follows the PromQL pattern | Grafana Loki documentation | ||
| Team lives in Kibana, needs KQL and ES\ | QL | Elastic Serverless | KQL plus ES\ | QL in one place | Elastic query languages docs |
| Small team, under 50 GB a month | Either free tier | 50 GB free on Grafana; no platform fee on Elastic | Grafana pricing; Elastic Serverless pricing |
Migrate in slices, not in one cutover. Ship one service's logs to the new system and run both for two weeks. Compare the same incident query on both — the time to first useful line, not the time to first line.
- [x] Measure daily ingest per service for a full week.
- [x] Price Profiles A, B, and C on both meters before choosing.
- [x] Fix the label set in writing: low-cardinality labels only.
- [x] Write the ILM policy or Compactor config before the first byte lands.
- [x] Run one service on both systems for two weeks and compare incident queries.
- [x] Set a volume alert at 80\% of the priced profile.
- [x] Re-price every quarter: list rates move.
Loki and Elasticsearch are not two prices for the same thing. They are two answers to what a log is for: a stream you already know how to find, or a record you may need to search any way at all.