Most email lists are run as a single list: one campaign goes to everyone, the same offer lands in every inbox, and revenue per send stays flat while unsubscribes climb. The list is not the problem. The absence of structure is. An owned list does not depend on an algorithm change or an advertising auction, and segmentation turns it into repeat revenue.
RFM sorts buyers by recency, frequency, and spend. Cohort retention tracks groups who joined or bought in the same month and measures how many stay active. Together they replace guesswork with a routine: score, sort, send, measure, adjust.
What RFM measures, and why three numbers beat one
RFM stands for Recency, Frequency, and Monetary value: days since the last order, orders in the measured period, and total spent in that period. Klaviyo defines its RFM report the same way, combining the three measures to assign each profile a customer group.
One number cannot do this work. Total spend flatters a customer who spent heavily once, two years ago, and has been silent since. Order count flatters a frequent buyer of low-priced items. Recency flatters a first-time buyer who may never return. Together the three scores separate a Champion from a one-time buyer, and a loyal customer from a high spender who is drifting away.
Scoring bands you can reproduce in a spreadsheet
The classic model scores each dimension from 1 to 5, with 5 as the strongest, and the combined score runs from 3 to 15. A code such as 5-4-5 tells the story at a glance. Bands below use a 12-month window and dollar amounts: set them from your own order data.
| Dimension | Score 5 | Score 4 | Score 3 | Score 2 | Score 1 |
|---|---|---|---|---|---|
| Recency (days) | 0-30 | 31-60 | 61-120 | 121-240 | 241 or more |
| Frequency (orders) | 6 or more | 4-5 | 3 | 2 | 1 |
| Monetary (spend) | 500 or more | 250-499 | 150-249 | 75-149 | Under 75 |
The combined score is simple addition:
A customer who ordered 12 days ago, placed 5 orders in the last year, and spent 320 dollars scores 5-4-4, a combined 13. One who ordered 200 days ago, placed 4 orders, and spent 410 dollars scores 2-4-4, a combined 10. Similar spend, different treatment: the first is active, the second drifting.
To score in a spreadsheet, export orders from your ESP or CRM as a CSV file, one row per order, with email, order date, and order value. Aggregate by email, then apply the bands.
How Klaviyo scores RFM, and where the playbook differs
Klaviyo's native report scores each dimension from 1 to 3, with 3 as the highest, and distributes customers across six RFM groups. By default, recency uses day limits of 365 and 180 days, while frequency and monetary value use the 33rd and 66th percentiles of your customer data. Thresholds can be fixed values instead: Klaviyo's example sets the score-3 thresholds at 4 purchases and 250 dollars.
The 1 to 5 playbook and Klaviyo's 1 to 3 report are the same model at different resolutions. Use the 1 to 5 bands in a spreadsheet or an ESP that lets you set thresholds, and Klaviyo's groups inside Klaviyo.
Klaviyo also sets a data floor: at least 500 customers with orders, 180 days of history with orders in the last 30 days, and some customers with 3 or more orders. RFM properties refresh every night, so a customer who orders today usually carries a new group tomorrow. Below that floor, score in a spreadsheet. Klaviyo also supports up to 4 RFM models per account, each with its own conversion metric and thresholds, so subscription orders can be scored separately. A model cannot be deleted once created, so choose its population before you save it.
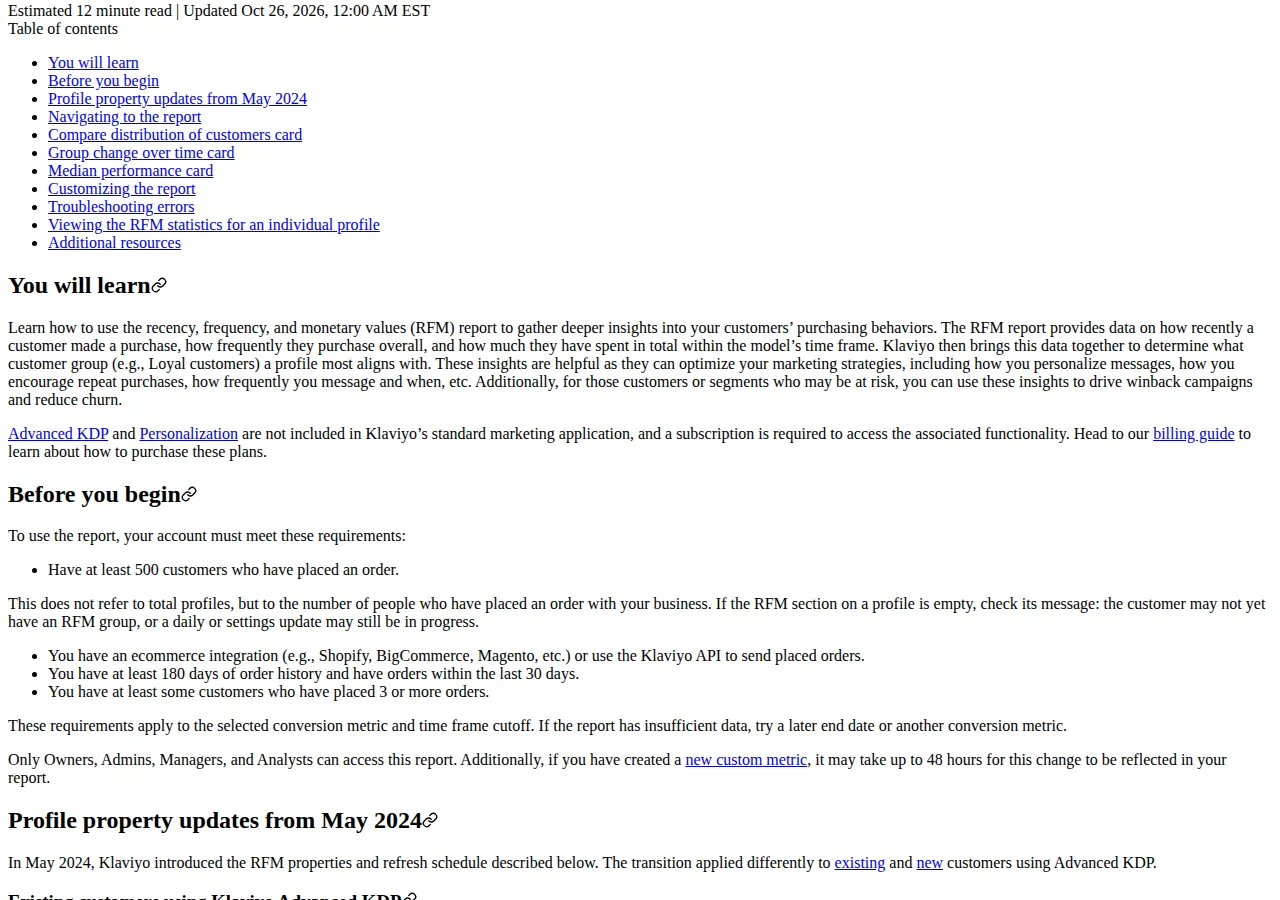
Klaviyo's RFM analysis report documentation, with the 500-customer requirement and nightly refresh.
The seven segments and what each one receives
Seven working segments cover nearly every buyer. Definitions use the 1 to 5 bands above.
| Segment | Definition | Action | Authority |
|---|---|---|---|
| Champions | R 4-5, F 4-5, M 4-5; recent, frequent, top spend | Early access, referral ask, no blanket discount | Klaviyo RFM report |
| Loyal Customers | R 3-5, F 3-4, M 3-4; steady repeat buyers | Loyalty perks, replenishment timing, cross-sell | Klaviyo RFM report |
| Potential Loyalists | R 4-5, F 2-3, M 2-3; recent, building frequency | Second-purchase nudge, education series | Klaviyo predictive analytics |
| Recent Buyers | R 5, F 1, M 1-3; first order, last 30 days | Onboarding, review ask, second-order window | Klaviyo predictive analytics |
| At Risk | R 1-2, F 3-5, M 3-5; good history, gone quiet | Win-back series, survey, one measured offer | Klaviyo RFM report |
| Cannot Lose Them | R 1, F 4-5, M 4-5; top spenders, long absent | Personal outreach, high-value win-back | Klaviyo RFM report |
| Hibernating | R 1, F 1-2, M 1-2; one small order, long ago | Sunset flow, then suppress | Mailchimp segmentation options |
Champions should never receive your deepest discount: they already buy at full price, so a discount trains them to wait for one.
Cohort retention: the math that shows whether people stay
RFM tells you who your customers are today. Cohort retention tells you whether they are still with you next month. A cohort is a group who share a starting point, usually the month of first purchase or joining the list. Track that group forward and count how many stay active in each later month. Mixpanel's retention documentation states the rule plainly: retention counts users, not event totals.
The formula is a single division, and the denominator never changes:
Take a January cohort of 1,200 first-time buyers, tracked by whether each buyer placed at least one order in the month measured. In Month 1, 420 ordered again. In Month 2, 312 ordered. In Month 3, 264 ordered.
The denominator stays at 1,200 in every month, so a falling percentage means people are genuinely leaving.
| Cohort | Size | Month 1 | Month 2 | Month 3 |
|---|---|---|---|---|
| January | 1,200 | 420, 35.0 percent | 312, 26.0 percent | 264, 22.0 percent |
| February | 900 | 288, 32.0 percent | 225, 25.0 percent | — |
February's Month 1 retention is 288 divided by 900, or 32.0 percent, and Month 2 is 225 divided by 900, or 25.0 percent. January holds up better in both months: ask what changed, the offer, the subscriber source, or the onboarding.
Two traps catch almost everyone. First, never average percentages across cohorts of different sizes: the simple average of 35.0 and 32.0 percent is 33.5 percent, but the correct combined Month 1 rate is 708 out of 2,100, or 33.7 percent. Combine raw counts first. Second, never divide by the previous month's survivors: 312 divided by 420 is 74.3 percent, a conditional rate, not cohort retention. Keep the denominator fixed.
Revenue per segment on a 10,000-subscriber list
Segmentation earns its keep when revenue per send differs between segments. Revenue per send is total revenue from a send divided by the number of emails sent, and it is the KPI that decides where your next campaign goes. Take a list of 10,000 subscribers: Champions 800, Loyal Customers 1,500, Potential Loyalists 2,200, Recent Buyers 1,800, At Risk 1,700, Cannot Lose Them 700, Hibernating 1,300. Send one campaign to three segments and work the numbers.
Champions: 800 sent, 6 percent convert, 48 orders at 62 dollars: revenue 48 times 62 is 2,976 dollars, revenue per send 2,976 divided by 800 is 3.72 dollars.
Loyal Customers: 1,500 sent, 3 percent convert, 45 orders at 54 dollars: revenue 45 times 54 is 2,430 dollars, revenue per send 2,430 divided by 1,500 is 1.62 dollars.
At Risk win-back: 1,700 sent, 1 percent convert, 17 orders at 48 dollars: revenue 17 times 48 is 816 dollars, revenue per send 816 divided by 1,700 is 0.48 dollars.
Across the three sends, revenue is 2,976 plus 2,430 plus 816, or 6,222 dollars, from 4,000 emails, so blended revenue per send is 6,222 divided by 4,000, or 1.56 dollars. Champions return more than twice the blended rate; the At Risk win-back returns less than a third. Run the same arithmetic with the ROI calculator and A/B test one change at a time.
The same numbers feed the lifetime view: a Champion's LTV is 62 times 4.2 times 3, or 781.20 dollars. At a 45-dollar CAC and 40 percent margin, the Champion repays acquisition in 45 divided by 24.80, or 1.81 orders, so 2 orders; the Loyal Customer in 45 divided by 21.60, or 2.08 orders, so 3 orders. That CAC payback test is why retention spending belongs on Champions and Loyal Customers first. For the platform behind these numbers, see our ESP pricing comparison.
Founder & CEO Insight — Enow A. Jovial
The predictive layer: CLV, churn risk, and next order date
RFM looks backward at what customers did. Predictive analytics look forward at what they are likely to do next, and both major ESPs ship these scores as segment conditions. Klaviyo's include predicted CLV, churn risk, and expected date of next order, retrained at least once a week. Predicted CLV covers the next year by default, and total CLV is historic plus predicted: Klaviyo's example shows 401 dollars historic and 99 dollars predicted, giving total CLV of 500 dollars. Churn risk rises as time passes since the last order and falls with each order; the same documentation shows 21 percent churn risk and 75 days between orders on average.
Mailchimp offers the same ideas under its own names: predicted next order date, churn risk at high, medium, or low, likelihood to purchase within 30, 60, 90, or 365 days, and predicted customer lifetime value. Its segments allow up to 10 conditions combined, so one can pair high churn risk with no opens in 60 days. Mailchimp also supports tags and a contact rating for engagement.
Use predictions as a layer on top of RFM, not a replacement. Build the RFM segment first, then split it by churn risk: low-risk Champions get early access, high-risk Champions get a check-in before they slide into At Risk.
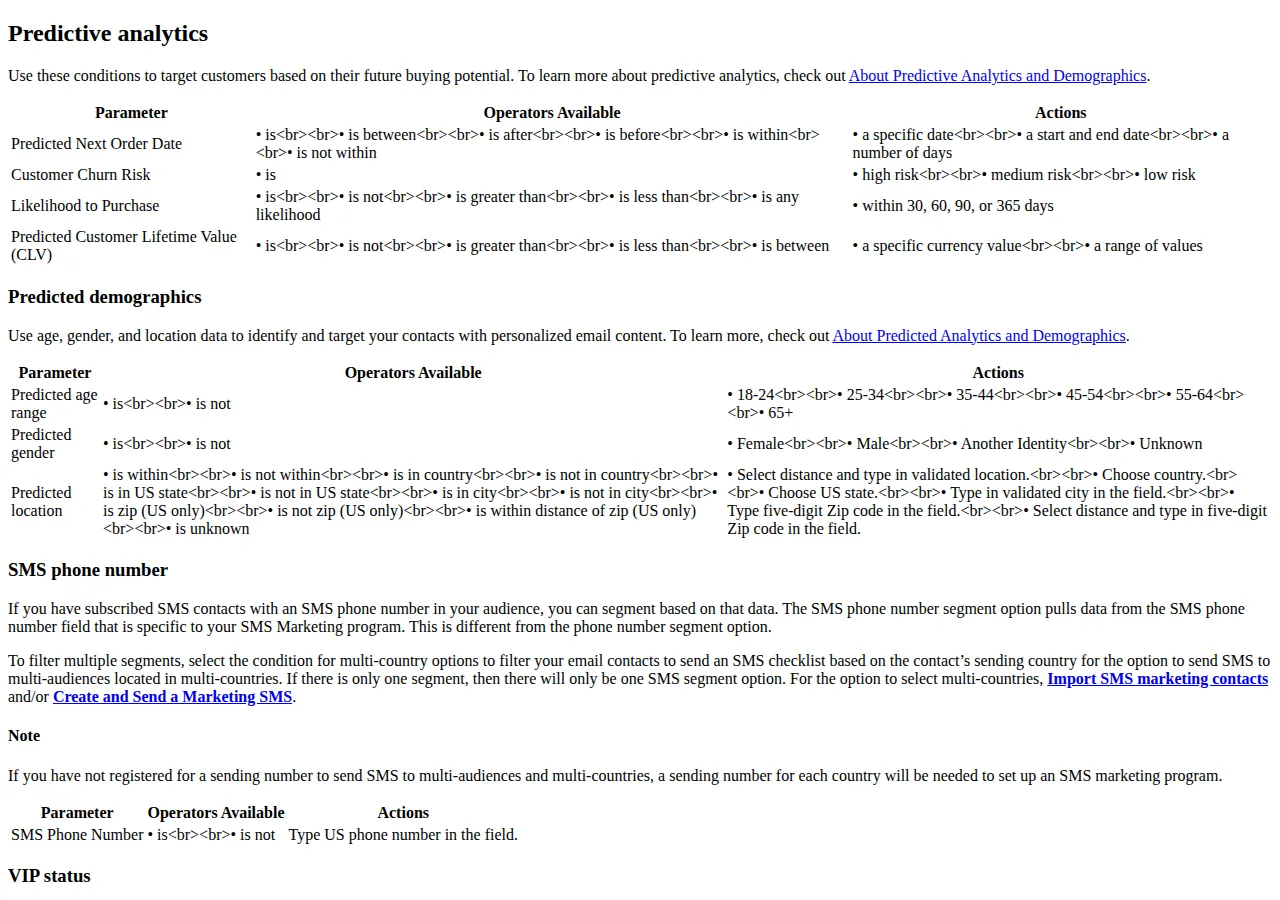
Mailchimp's segmentation documentation, showing the predictive analytics conditions the article cites.
Implementation sequence
- Export orders and subscribers: one CSV file of orders with email, order date, and order value, and one of subscribers with email, signup date, and consent status. Match them on email in your CRM or spreadsheet, and count subscribers who have never ordered.
- Choose your window and bands. Set the measurement window, usually 12 months, and write down the bands. Widen the recency bands if your purchase cycle runs longer than 90 days.
- Score every buyer and assign one segment. Apply the bands, compute the combined score, and map each buyer to one of the seven segments. Count each segment and check the shares.
- Build the segments in your ESP: RFM group properties in Klaviyo, or tag, purchase, and engagement conditions in Mailchimp. Add an engagement condition to every segment you will send to.
- Write one message per segment. Champions get early access, Loyal Customers get replenishment timing, Potential Loyalists get a second-purchase nudge, Recent Buyers get onboarding, At Risk gets a win-back series, Cannot Lose Them gets personal outreach, and Hibernating gets a sunset flow. Set each segment's cadence.
- Build the cohort table and set the review rhythm. Group first-time buyers by month, define active as at least one order in the month, and fill in Month 1, Month 2, and Month 3 retention. Review monthly; change one thing at a time.
Execution checklist
- [x] Order and subscriber CSV files exported, matched on email, never-ordered subscribers counted
- [x] Twelve-month window chosen and RFM bands written down
- [x] Every buyer scored 1 to 5 on recency, frequency, and monetary value, one segment assigned
- [x] Seven segments built in the ESP, engagement condition on every sendable segment
- [x] One message and cadence per segment, no blanket discount to Champions
- [x] Cohort table built by first-purchase month, denominator fixed at cohort size
- [x] Monthly review set: revenue per send by segment, cohort retention, one change per cycle
Consent, hygiene, and deliverability
Segmentation does not override consent. Under GDPR, you need a lawful basis to send marketing email, and under CAN-SPAM every message must identify the sender and offer a way to opt out. Keep consent status in the same record as the RFM scores. Use your ESP's API or CSV import for data moves. Suppress Hibernating subscribers after the sunset flow, remove hard bounces promptly, and watch complaint rates by segment. Confirm your sending domain carries valid SPF, DKIM, and DMARC records before you scale sending; our cold email deliverability guide covers those records and the SMTP sending path they protect.
What to measure from here
Segmentation is finished when it runs as a routine, not as a project. Each month, record revenue per send for every segment, update the cohort table, and note which segments grew and which shrank. Replace the worked numbers with your own.