A business can be profitable for the month and still miss payroll on the 15th. The profit and loss statement says the month was fine; the bank account says the large customer payment lands on the 28th and payroll drafts on the 15th. That thirteen-day gap is the whole reason the 13-week cash flow forecast exists. It is the document lenders, turnaround advisors, and covenant teams ask for first, because it answers "will we have enough cash next Friday?" Methods as read on November 16, 2026, from the two practitioner guides cited below.
The structure: a matrix, not a report
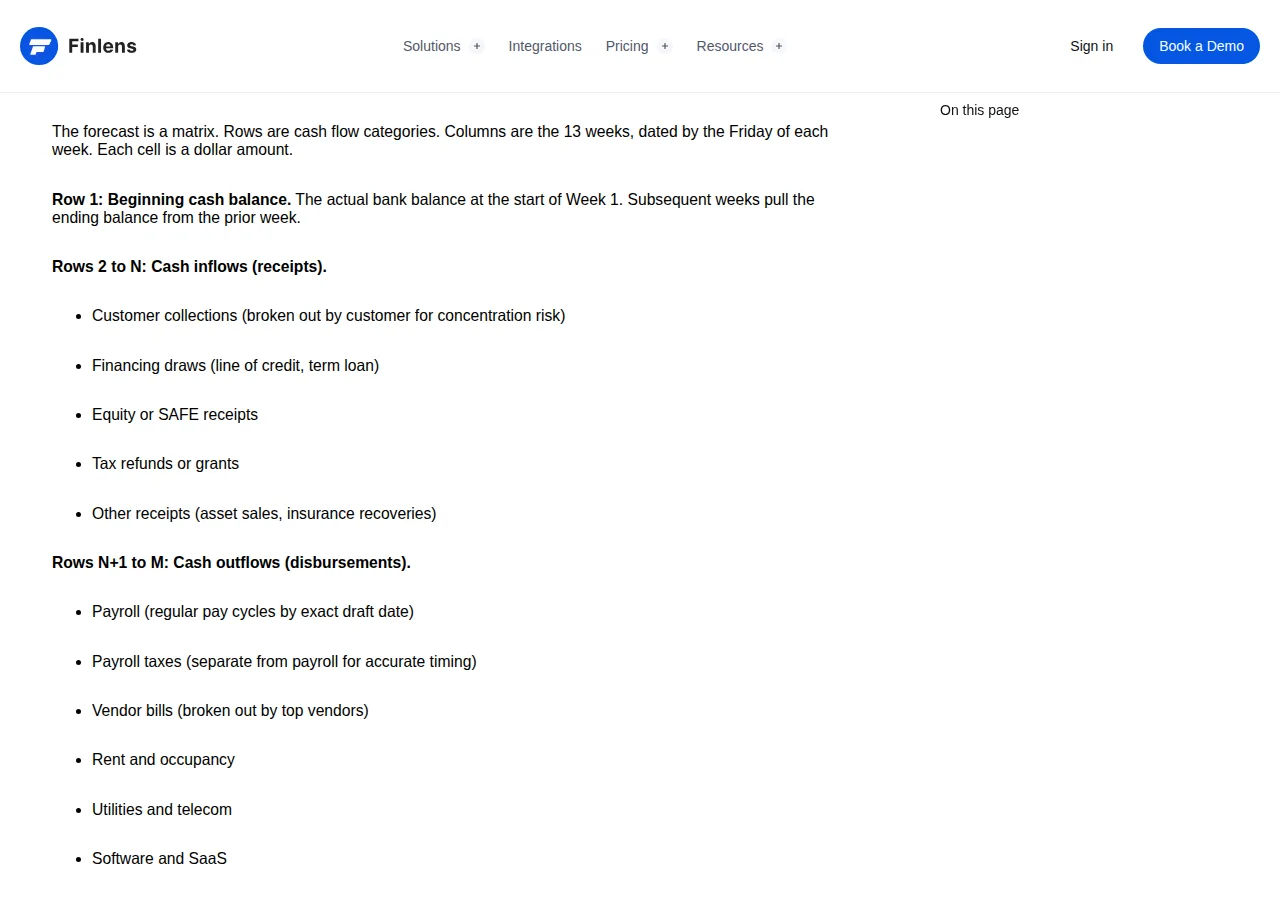
The forecast is a matrix: rows are cash categories, columns are the 13 weeks dated by Friday, every cell a dollar amount — the structure Finlens sets out, and the one turnaround advisors, restructuring bankers, and lender covenant teams all use:
- Row 1: Beginning cash balance. The reconciled bank balance at the start of week 1 — across all operating accounts, not the balance in the accounting software, and not counting uncleared deposits or restricted funds.
- Rows 2 to N: Cash inflows (receipts). Customer collections, broken out by customer for concentration risk; card processor and marketplace payouts; financing draws; equity or SAFE receipts; tax refunds or grants; other receipts such as asset sales or insurance recoveries.
- Rows N+1 to M: Cash outflows (disbursements). Payroll, mapped to the exact pay dates, usually paid by ACH direct deposit; payroll taxes (FICA), kept separate so the timing stays accurate; vendor bills, broken out by top vendor; rent; utilities; software and SaaS; insurance; debt service; income tax; sales tax; capital expenditures; owner draws.
- Row M+1: Net cash flow. Receipts minus disbursements for the week.
- Row M+2: Ending cash balance. Beginning cash plus net cash flow, and the next week beginning balance.
- Row M+3 (optional, and the one lenders watch): Available liquidity. Ending cash plus undrawn credit facility capacity. A week can show a cash gap and still be safe if the undrawn line covers it — the gap is a timing problem, not insolvency.
Three properties decide whether it works. First, it is direct-method throughout: no depreciation, no accruals, no non-cash entries. Loan principal and owner draws stay in; depreciation stays out. EBITDA is not cash either — a profitable quarter on an EBITDA basis can still miss payroll. Second, every receipt and payment is placed by the week the money moves, not the week it is earned or due. A customer on net 30 terms who actually pays in 52 days is forecast at 52 days. Third, 13 weeks fits 30-, 60-, and 90-day terms inside the window: the forecast captures the collection ramp without projecting further than the accounts receivable (AR) aging supports.
Build it in seven steps
The build follows the seven steps Universal Funding sets out in its 13-week guide.
- Set up 13 weekly columns. One column per week, labeled with the week-ending date — the Friday of each week — plus a final column for the 13-week total. Pick one week end and never change it mid-quarter.
- Enter the beginning cash balance. The actual bank balance on the first day of week 1, across all operating accounts — not uncleared deposits or restricted funds.
- Forecast receipts by week. Start with the AR aging report and assign each open invoice to the week you realistically expect payment, based on how that customer pays. Then add new sales: estimate the invoices you will issue and push them out by your average days to collect. Add cash sales, card settlements, retainers, and deposits, then other receipts — tax refunds, asset sales, loan draws, factoring advances.
- Forecast disbursements by week. Map payroll and payroll taxes to the exact pay dates; these are usually the largest and least flexible payments. Vendors go by the accounts payable (AP) aging and the terms you pay on. Rent, utilities, insurance, and subscriptions go in their due week. Debt service, taxes, capital spending, and one-time items follow the same rule: the week the money clears.
- Calculate net cash flow and ending cash. Two formulas, applied identically in every column:
- Set a minimum cash threshold and flag gaps. Decide the lowest balance you will hold: one full payroll cycle plus one week of fixed operating costs. Add a row comparing ending cash to the minimum; any week below it is a cash gap to plan for now.
- Update weekly and roll it forward. Every week, replace the forecast for the week just ended with actual numbers, note the variance, and add a new week 13 at the end. Tracking forecast versus actual shows where the assumptions are wrong, so each forecast gets more accurate than the last.
The worked example: six weeks, one gap
The example below is our own illustrative model — a B2B services firm with biweekly payroll — every number verified by the formulas. It shows only the first six weeks; a full model runs all thirteen. The firm starts with $48,000 in the bank and holds a $25,000 minimum: one biweekly payroll cycle of $18,000 plus one week of fixed costs. Weeks end on Fridays, November 20 to December 25, 2026.
| Week ending | Beginning | Receipts | Disbursements | Net | Ending | Surplus vs $25,000 |
|---|---|---|---|---|---|---|
| Nov 20 | $48,000 | $27,000 | $15,000 | +$12,000 | $60,000 | |
| Nov 27 | $60,000 | $22,000 | $31,500 | −$9,500 | $50,500 | |
| Dec 4 | $50,500 | $34,000 | $20,500 | +$13,500 | $64,000 | |
| Dec 11 | $64,000 | $11,000 | $36,500 | −$25,500 | $38,500 | |
| Dec 18 | $38,500 | $24,000 | $23,000 | +$1,000 | $39,500 | |
| Dec 25 | $39,500 | $15,000 | $35,500 | −$20,500 | $19,000 |
Check the worst week, December 11: the firm collects only $11,000 while payroll of $18,000, payroll taxes of $2,700, a $14,000 vendor prepayment, and $1,800 of other costs clear — $36,500 out against $11,000 in, a net of −$25,500. Six-week totals: $133,000 in, $162,000 out, a net of −$29,000. The monthly view names no date. The weekly view names the date: the week ending December 25, when the balance falls $6,000 below the floor.
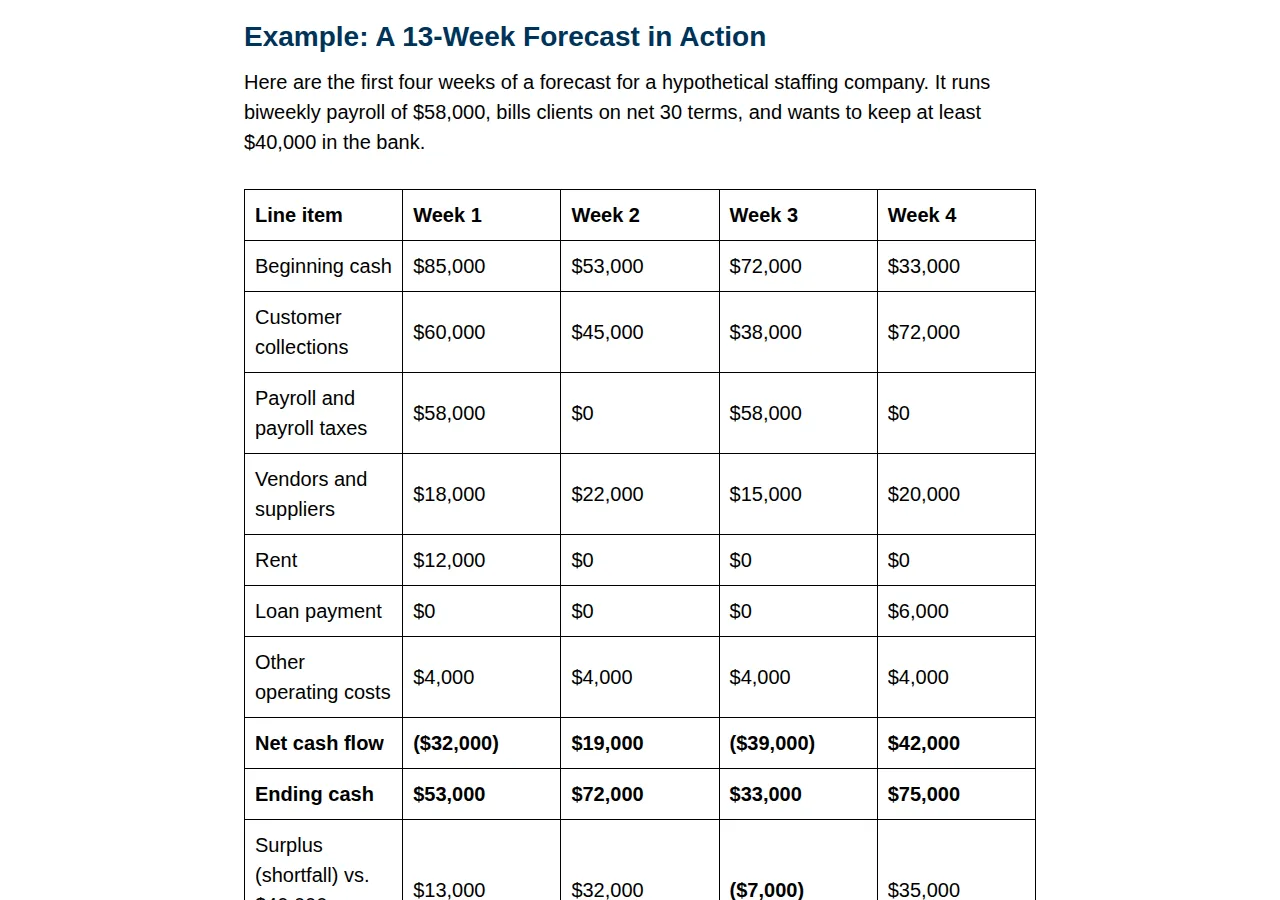
The published example in the image above makes the same point with different numbers — a staffing company running biweekly payroll of $58,000 that drops to $33,000 in week 3, $7,000 below its $40,000 minimum. The owner sees the gap three weeks early and has time to act. Our example adds the second half: the gap week is not the payroll week. December 11 survives at $38,500; the gap lands two weeks later, on December 25, when the annual insurance premium of $6,000 clears on top of the third payroll.
The Monday roll and variance tracking
The roll is the discipline that separates a forecast from a spreadsheet. Every Monday: drop the past week and replace its forecast with actual bank activity; refresh the forward weeks; and add a new week 13. Then record the variance per category:
In our example, suppose week 2 collections actually arrive at $17,500 against a $19,000 forecast. The variance is −$1,500, or −7.9%. One week of −7.9% is noise. Three consecutive weeks of negative collection variance is a signal: the collection assumption is wrong. The fix is mechanical — re-time the receivables by actual payment behavior. Have your CPA review the variance log quarterly; a pattern of the same category missing in the same direction is a process failure, not a forecasting failure.
In our example the firm holds a $30,000 undrawn line of credit. In the gap week, ending cash is $19,000 and available liquidity is $49,000 — the gap is covered, at the interest cost of a $6,000 draw for a few days. A forecast that shows the draw, the repayment week, and the restored floor is a forecast a lender will fund.
The six mistakes that break the model
Universal Funding lists six mistakes in almost every first 13-week model. Using invoice terms instead of real payment behavior puts every receipt in the wrong week — forecast 52 days for the customer who pays in 52 days. Mixing profit with cash puts depreciation and accrued expenses into a model that only counts money moving. Forgetting irregular payments — quarterly taxes, annual insurance, software renewals — is how a healthy forecast produces a surprise shortfall; in our example the $9,000 tax in week 5 and the $6,000 insurance premium in week 6 are both dated in advance. Being too optimistic on collections produces a pleasant forecast and an empty account; forecast collections conservatively. Building it once and never updating it leaves the model frozen while the business moves — the roll is the product. Ignoring customer concentration leaves the whole forecast hostage to one payer; model the top customer slipping two weeks.
Founder & CEO Insight — Enow A. Jovial
When the forecast shows a gap: the levers, in order
A gap seen six weeks early is a phone call; the same gap discovered on the Friday payroll drafts is a crisis. Speed up collections first: invoice the same day work is done, follow up before the due date, and offer a small early-payment discount — 2% for payment in 10 days costs far less than a missed payroll. Adjust payment timing second: ask key vendors for extended terms, or split a large payment across two weeks. Trim or delay discretionary spending third: push nonessential purchases until after the gap. Draw on financing last, and price it: a $6,000 line draw for two weeks at a 12% annual rate costs about $28 in interest, and the business loan calculator runs the payment and amortization for any draw size before you take it. Invoice factoring is the same lever in a different form — it moves a receipt from week 6 or week 8 into the week you need it, at a discount rather than an interest rate.
Average weekly disbursements run $162,000 over six weeks, or $27,000 a week — about $3,857 a day. The $25,000 floor therefore covers roughly 6.5 days of outflows:
A floor that covers less than one average week is thin for a business whose collections swing by $20,000 week to week. The honest response is to raise the floor to two payroll cycles, $36,000 plus a week of fixed costs.
Who it is for, and what it is not
The forecast earns its keep for any business that pays bills before customers pay invoices — net 30, 60, or 90 terms with weekly or biweekly payroll, seasonal swings, large one-time payments, fast growth that must fund inventory and labor before revenue arrives — and for any LLC, S-Corp, or C-Corp whose lender, factoring company, or turnaround advisor asks for one.
What it is not: a budget, a P&L, or a cash flow statement. A budget plans revenue and expenses by month or year; a P&L reports them as earned, on the accrual basis; a cash flow statement reconciles net income to cash, usually by the indirect method. The cash conversion cycle playbook prices the working-capital cycle that feeds the forecast — DIO plus DSO minus DPO — and the cash vs accrual guide covers the basis distinction it depends on.
Execution checklist
- [x] Step 1: Open the model with 13 Friday-dated columns — one consistent week end, plus a total column.
- [x] Step 2: Enter the reconciled bank balance — all operating accounts, no uncleared deposits or restricted funds.
- [x] Step 3: Place receipts by actual collection week — AR aging first, actual payment behavior, not invoice terms; top three by name.
- [x] Step 4: Place disbursements by clearing week — payroll by draft date, payroll taxes separate, vendors by AP aging, irregular items dated in advance.
- [x] Step 5: Compute net and ending cash per week — ending cash carries forward as the next week beginning cash.
- [x] Step 6: Set the minimum and flag the gaps — one payroll cycle plus one week of fixed costs.
- [x] Step 7: Roll every Monday — actuals replace forecast, variance logged, forward weeks refreshed, new week 13 added.
- [x] Step 8: Run the concentration scenario weekly — top customer two weeks late, while it is more than a fifth of the book.